
Fig. 2
- ID
- ZDB-FIG-230325-20
- Publication
- Sipka et al., 2022 - Macrophages undergo a behavioural switch during wound healing in zebrafish
- Other Figures
- All Figure Page
- Back to All Figure Page
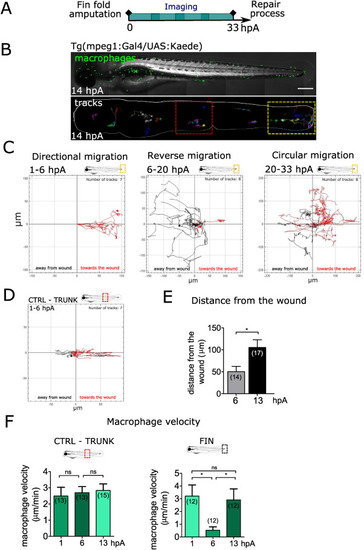
Fig. 2. Macrophages undergo a stereotypical migratory behaviour at the wound (A) Schedule of the experiments. Tg(mpeg1:gal4/UAS:Kaede) larvae with mosaic expression of Kaede protein in macrophages were amputated at 3 dpf and imaged using high resolution Spinning Disk microscopy for one of consecutive periods lasting between 5 and 15 h, that together spanned 72 h of regeneration spanning 3 days of regeneration. (B) Up: representative frame from 5.5 to 14 hpA time-lapse video of mosaically labelled macrophage population in the whole larva (14 hpA). Scale bar: 250 μm. Down: Representative tracks of macrophages representing the paths of individual macrophages from 5.5 to 14 hpA. (C) Macrophage migration directionality, in the wound region, during defined periods showing different migration modes: directional (period 1–6 hpA), reverse (period 6–20 hpA) and circular migration (period 20–33). The tracks with the directionality toward the wound are coloured in red, while the tracks with the directionality away from the wound are black. Number of macrophage tracks and the time period covered by graph are indicated above each graph. (D) Macrophage migration directionality in the unaffected trunk region (CTRL). The tracks with the directionality toward the wound are coloured in red, while the tracks with the directionality away from the wound are black. Number of macrophage tracks is indicated above the graph. (E) Quantification of wound distance value corresponding to the shortest distance measured from the wound margin to the center of each individual macrophage at 6 and 13 hpA. Number of macrophages is indicated in parenthesis. (mean±standard error of the min (sem)) Representative experiment of five independent experiments, two-tailed paired t-test, *p < 0.05. (F) Quantification of individual macrophage velocity at the control (CTRL) trunk region (left) and at the wound at 1, 6 and 13 hpA. Number of analysed macrophages is indicated in the graph. (mean±sem) Representative experiment of three independent experiments, two-tailed paired t-test, *p < 0.05, ns – not significant. (For interpretation of the references to colour in this figure legend, the reader is referred to the Web version of this article.) |
Reprinted from Free radical biology & medicine, 192, Sipka, T., Park, S.A., Ozbilgic, R., Balas, L., Durand, T., Mikula, K., Lutfalla, G., Nguyen-Chi, M., Macrophages undergo a behavioural switch during wound healing in zebrafish, 200-212, Copyright (2022) with permission from Elsevier. Full text @ Free Radic. Biol. Med.