
Figure 2
- ID
- ZDB-FIG-230221-2
- Publication
- van der Plas et al., 2023 - Neural assemblies uncovered by generative modeling explain whole-brain activity statistics and reflect structural connectivity
- Other Figures
- All Figure Page
- Back to All Figure Page
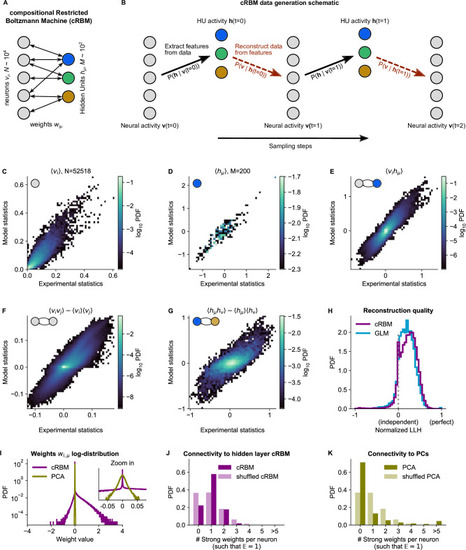
(A) Schematic of the cRBM architecture, with neurons on the left, HUs on the right, connected by weights . (B) Schematic depicting how cRBMs generate new data. The HU activity is sampled from the visible unit (i.e. neuron) configuration , after which the new visible unit configuration is sampled and so forth. (C) cRBM-predicted and experimental mean neural activity were highly correlated (Pearson correlation , ) and had low error (, normalized Root Mean Square Error, see Materials and methods - ‘Calculating the normalized Root Mean Square Error’ ). Data displayed as 2D probability density function (PDF), scaled logarithmically (base 10). (D) cRBM-predicted and experimental mean Hidden Unit (HU) activity also correlated very strongly (, ) and had low (other details as in C) (E) cRBM-predicted and experimental average pairwise neuron-HU interactions correlated strongly (, ) and had a low error (). (F) cRBM-predicted and experimental average pairwise neuron-neuron interactions correlated well (, ) and had a low error (, where the negative nRMSE value means that cRBM-predictions match the test data slightly better than the train data). Pairwise interactions were corrected for naive correlations due to their mean activity by subtracting . (G) cRBM-predicted and experimental average pairwise HU-HU interactions correlated strongly (, ) and had a low error (). (H) The low-dimensional cRBM bottleneck reconstructs most neurons above chance level (purple), quantified by the normalized log-likelihood (nLLH) between neural test data vi and the reconstruction after being transformed to HU activity (see Materials and methods - ‘Reconstruction quality’). Median normalized = 0.24. Reconstruction quality was also determined for a fully connected Generalized Linear Model (GLM) that attempted to reconstruct the activity of a neuron vi using all other neurons (see Materials and methods - ‘Generalized Linear Model’). The distribution of 5000 randomly chosen neurons is shown (blue), with median . The cRBM distribution is stochastically greater than the GLM distribution (one-sided Mann Whitney U test, ). (I) cRBM (purple) had a sparse weight distribution, but exhibited a greater proportion of large weights than PCA (yellow), both for positive and negative weights, displayed in log-probability. (J) Distribution of above-threshold absolute weights per neuron vi (dark purple), indicating that more neurons strongly connect to the cRBM hidden layer than expected by shuffling the weight matrix of the same cRBM (light purple). The threshold was set such that the expected number of above-threshold weights per neuron . (K) Corresponding distribution as in (J) for PCA (dark yellow) and its shuffled weight matrix (light yellow), indicating a predominance of small weights in PCA for most neurons vi. All panels of this figure show the data statistics of the cRBM with parameters and (best choice after cross-validation, see Figure 2—figure supplement 1) of example fish #3, comparing the experimental test data test and model-generated data after cRBM training converged.
|