
Figure 6
- ID
- ZDB-FIG-230221-15
- Publication
- van der Plas et al., 2023 - Neural assemblies uncovered by generative modeling explain whole-brain activity statistics and reflect structural connectivity
- Other Figures
- All Figure Page
- Back to All Figure Page
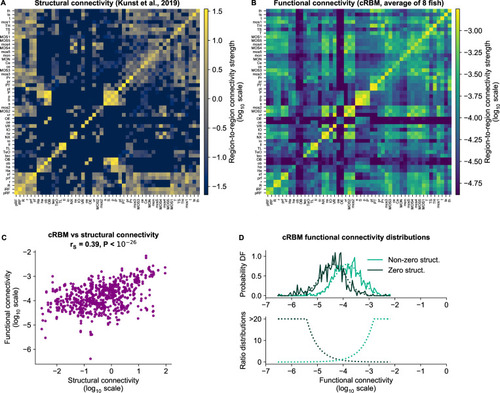
(A) Structural connectivity matrix is shown in log10 scale, updated from Figure 8C of Kunst et al., 2019. Regions that were not imaged in our experiments were excluded (such that out of 72 regions remain). Regions (x-axis and y-axis) were sorted according to Kunst et al., 2019. Compared to Figure 8C of Kunst et al., 2019 additional structural data was added and the normalization procedure was updated to include within-region connectivity (see Materials and methods - ‘Extensions of the structural connectivity matrix’). See Supplementary file 1 for region name abbreviations. (B) Average functional connectivity matrix is shown in log10 scale, as determined by averaging the cRBM functional connectivity matrices of all 8 fish (see Materials and methods - ‘Specimen averaging of connectivity matrices’). The same regions (x-axis and y-axis) are shown as in panel A. (C) The average functional and structural connectivity of panels A and B correlate well, with Spearman correlation (, two-sided t-test). Each data point corresponds to one region-to-region pair. Data points for which the structural connection was exactly 0 were excluded (see panel D for their analysis). (D) The distribution of average functional connections of region pairs with non-zero structural connections is greater than functional connections corresponding to region pairs without structural connections (, two-sided Kolmogorov-Smirnov test). The bottom panel shows the evidence for inferring either non-zero or zero structural connections, defined as the fraction between the PDFs of the top panel (fitted Gaussian distributions were used for denoising).
|