
Figure 1
- ID
- ZDB-FIG-230221-1
- Publication
- van der Plas et al., 2023 - Neural assemblies uncovered by generative modeling explain whole-brain activity statistics and reflect structural connectivity
- Other Figures
- All Figure Page
- Back to All Figure Page
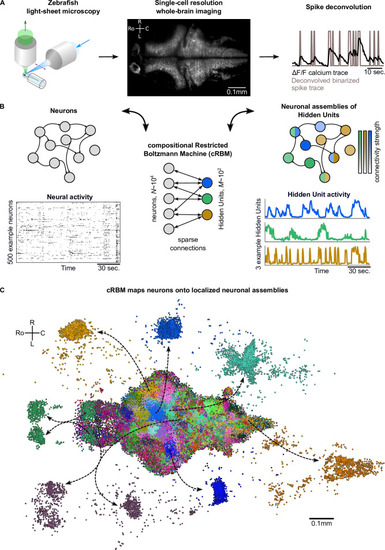
(A) The neural activity of zebrafish larvae was imaged using light-sheet microscopy (left), which resulted in brain-scale, single-cell resolution data sets (middle, microscopy image of a single plane shown for fish #1). Calcium activity was deconvolved to binarized spike traces for each segmented cell (right, example neuron). (B) cRBM sparsely connects neurons (left) to Hidden Units (HUs, right). The neurons that connect to a given HU (and thus belong to the associated assembly), are depicted by the corresponding color labeling (right panel). Data sets typically consist of neurons and HUs. The activity of 500 randomly chosen example neurons (raster plot, left) and HUs 99, 26, 115 (activity traces, right) of the same time excerpt is shown. HU activity is continuous and is determined by transforming the neural activity of its assembly. (C) The neural assemblies of an example data set (fish #3) are shown by coloring each neuron according to its strongest-connecting HU. 7 assemblies are highlighted (starting rostrally at the green forebrain assembly, going clockwise: HU 177, 187, 7, 156, 124, 64, 178), by showing their neurons with a connection . See Figure 3 for more anatomical details of assemblies. R: Right, L: Left, Ro: Rostral, C: Caudal.
|