
FIGURE
Fig. 7
- ID
- ZDB-FIG-230114-36
- Publication
- Turan et al., 2021 - Effect of modulating glutamate signaling on myelinating oligodendrocytes and their development-A study in the zebrafish model
- Other Figures
- All Figure Page
- Back to All Figure Page
Fig. 7
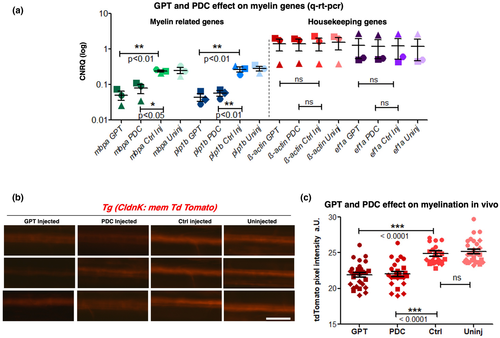
Glutamate degrading and blockade of glutamate uptake significantly decreased myelin-related genes and myelination. (a) After zfl ventricle injections at 3 dpf with the Glutamate-Pyruvate-Transaminase (GPT) and the glutamate transport inhibitor L-trans-pyrrolidine-2,4-dicarboxylate (PDC), CNRQ values representing mRNA quantification of mbpa, plp1b, ß-actin, and ef1a genes were analyzed. Data are from 10 U/ml GPT + 50 µM Pyruvate, 2 mM PDC, sham vehicle-injected and untreated zebrafish larvae (wild type, 5 dpf). The housekeeping genes ß-actin and ef1a do not show any significant difference. mRNA levels could therefore be normalized against ß-actin and ef1a housekeeping gene expression. For both pharmacological treatments supposed to reduce extracellular glutamate, we could find a significant decrease of the myelin-related genes mbpa and plp1b in 5 dpf zfl. Data were evaluated by one-way ANOVA followed by Bonferroni's multiple comparisons to compare the means among the four groups. ** indicates a p-value < 0.01; *** indicates a p-value < 0.001. Values show mean ± SEM. N = 3 independent experiments indicated by different shaped dots. (b) Low-resolution epi-fluorescence microscopic images of 5 dpf Tg(ClaudinK:mem-TdTomato) zfl spinal cords in lateral view demonstrate in vivo decrease of myelination after injections of GPT and PDC at 3 dpf. Clear decrease in myelination in 10 U/ml GPT + 50 µM Pyruvate treated larvae (left column) and 2 mM PDC-treated larvae (second from left) could be seen compared to sham vehicle-injected (second from right) or uninjected larvae (right) controls by examination of ClaudinK:mem-TdTomato fluorescence intensities as direct myelin reporter. Scale bar 50 µm. (c) Quantification of relative CldnK:mem-TdTomatof fluorescence intensities as a parameter for myelination. Images of all experiment were acquired under the same microscopy settings. The fluorescence level (pixel intensity) of the proximal spinal cord of each fish was quantified at the same selected region. Both 10 U/ml GPT + 50 µM Pyruvate and 2 mM PDC injected larvae show a significant decrease in myelination compared to the sham vehicle-injected control or the uninjected control. While no difference is seen between uninjected versus vehicle-injected larvae. Dot plot graphs show average values of pixel density areas as mean ± StDev. p-values are significant ***p < 0.001; one-way ANOVA followed by Bonferroni's multiple comparisons. N = 3 independent experiments with a total of 90 to 110 larvae (n). Each dot shape indicates the identity of a certain data point to the appropriate experiment (N)
|
Expression Data
Expression Detail
Antibody Labeling
Phenotype Data
Phenotype Detail
Acknowledgments
This image is the copyrighted work of the attributed author or publisher, and
ZFIN has permission only to display this image to its users.
Additional permissions should be obtained from the applicable author or publisher of the image.
Full text @ J. Neurosci. Res.