
FIGURE
Fig. 2
- ID
- ZDB-FIG-230114-31
- Publication
- Turan et al., 2021 - Effect of modulating glutamate signaling on myelinating oligodendrocytes and their development-A study in the zebrafish model
- Other Figures
- All Figure Page
- Back to All Figure Page
Fig. 2
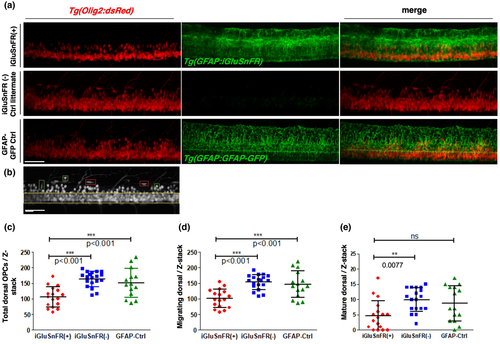
The number of Olig2(+) OPCs is reduced in iGluSnFR-expressing zebrafish at 3 dpf. (a) Z-projections of proximal spinal cord regions in lateral view obtained by two-photon microscopy. The top row shows double transgenic animals expressing Olig2:dsRed and GFAP:iGluSnFR. In the middle row, iGluSnFR(−) littermate controls are shown. The bottom row shows images of double transgenic larvae fish expressing Olig2:dsRed and GFAP:GFAP-GFP. These GFAP:GFAP-GFP fish serve as an external control for the overexpression of fluorescent proteins under the GFAP promoter, in general. Red and green channels are presented in the left and middle image of each row, respectively. The third right image shows a merged of both channels. A clear difference in dsRed(+) cell numbers (OPCs) is already visible by eye. Larvae fish that express iGluSnFR noticeably appear to have reduced numbers of labeled OPCs. Scale bar: 50 μm. (b) Example b/w image of a Tg(Olig2:dsRed) zebrafish larvae taken at a comparable spinal cord region like in (a) to demonstrate the ventral region of the spinal cord in between the two yellow lines as well as some typical more roundish or ventral-dorsal elongated “migratory OPCs” (green squares) and some typical “more mature OPCs” with a rather horizontal flat/ellipsoid shape (red squares). Scale bar: 20 μm. (c–e) Quantification of the number of dorsal OPCs. The number of dorsal OPCs was quantified by counting all dsRed+ cells above the upper ventral boarder (yellow line) per Z-stack. Each Z-stack had the same dimensions in x, y, and z and was obtained from approximately the same region in the fish. The total number of dorsal OPCs was significantly reduced in iGluSnFR-expressing fish (c). For migratory OPCs (green squares in b), we also observed a significant reduction in iGluSnFR-expressing fish compared to both controls (d). Concerning the more mature OPCs (red squares in b), we only found a significant reduction when comparing the iGluSnFR-expressing fish with iGluSnFR(−) littermate controls (e). The iGluSnFR(−) and GFAP-Ctrl larvae do not show any significant difference between them. Data were analyzed by one-way ANOVA followed by Bonferroni's multiple comparisons. *** indicates a p-value < 0.001. ** indicates a p-value < 0.01; (c) F = 13.66; df = 49; (d) F = 13.75; df = 50; (e) F = 5.413; df = 49. Dot plot graphs show arithmetic mean ± standard deviation. N = 3, n in iGluSnFR(+) = 17; n in iGluSnFR(−) = 19 and n in GFAP-Ctrl = 14
|
Expression Data
Expression Detail
Antibody Labeling
Phenotype Data
Phenotype Detail
Acknowledgments
This image is the copyrighted work of the attributed author or publisher, and
ZFIN has permission only to display this image to its users.
Additional permissions should be obtained from the applicable author or publisher of the image.
Full text @ J. Neurosci. Res.