
FIGURE
Fig. 1
- ID
- ZDB-FIG-230114-30
- Publication
- Turan et al., 2021 - Effect of modulating glutamate signaling on myelinating oligodendrocytes and their development-A study in the zebrafish model
- Other Figures
- All Figure Page
- Back to All Figure Page
Fig. 1
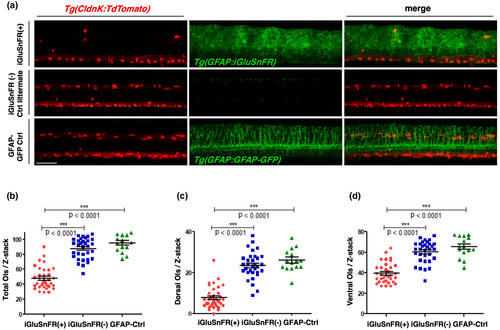
iGluSnFR expression under the GFAP promoter reduces significantly the myelinating oligodendrocyte number in zebrafish. The number of ClaudinK(+) OLs was reduced in iGluSnFR-expressing zebrafish larvae at 5 dpf. (a) Z-projections of proximal spinal cord regions in lateral view obtained by two-photon in vivo microscopy. The top row shows double transgenic fish expressing GFAP:iGluSnFR and ClaudinK:TdTomato. In the second row, iGluSnFR(−) littermate controls are shown. The third row shows images of double transgenic fish expressing GFAP:GFAP-GFP and ClaudinK:TdTomato. Red and green channels are presented in the first and second image of each row, respectively. The third right image is a merge of both channels. Fish that express iGluSnFR appear to have reduced numbers of red-labeled OLs. Scale bar: 50 μm. (b–d) Quantification of cell numbers of total (b), dorsal (c), and ventral (d) OLs. The number of OLs was quantified by counting TdTomato(+) cells per Z-stack. Each Z-stack had the same dimensions in x, y, and z and was obtained from approximately the same region within the fish. The total number of OLs was significantly reduced in iGluSnFR-expressing fish (red dots) (b). Both regions (dorsal and ventral) show significant OL loss (c, d). However, the percentage decrease in dorsal OL numbers was higher (c). The iGluSnFR(−) (blue squares) and GFAP-Ctrl (green triangles) larvae do not show any significant difference between each other. Data were analyzed by one-way ANOVA followed by Bonferroni's multiple comparisons. *** indicates a p-value < 0.001; (b) F = 91.47; df = 80; (c) F = 80.49; df = 80; (d) F = 49.28; df = 80. Dot plots show arithmetic mean ± standard deviation. N = 3, n in iGluSnFR(+) = 34; n in iGluSnFR(−) = 32 and n in GFAP-Ctrl = 15
|
Expression Data
Expression Detail
Antibody Labeling
Phenotype Data
Phenotype Detail
Acknowledgments
This image is the copyrighted work of the attributed author or publisher, and
ZFIN has permission only to display this image to its users.
Additional permissions should be obtained from the applicable author or publisher of the image.
Full text @ J. Neurosci. Res.