
- Title
-
Effect of modulating glutamate signaling on myelinating oligodendrocytes and their development-A study in the zebrafish model
- Authors
- Turan, F., Yilmaz, Ö., Schünemann, L., Lindenberg, T.T., Kalanithy, J.C., Harder, A., Ahmadi, S., Duman, T., MacDonald, R.B., Winter, D., Liu, C., Odermatt, B.
- Source
- Full text @ J. Neurosci. Res.
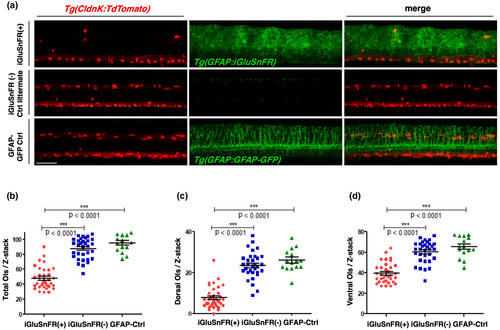
iGluSnFR expression under the GFAP promoter reduces significantly the myelinating oligodendrocyte number in zebrafish. The number of ClaudinK(+) OLs was reduced in iGluSnFR-expressing zebrafish larvae at 5 dpf. (a) Z-projections of proximal spinal cord regions in lateral view obtained by two-photon in vivo microscopy. The top row shows double transgenic fish expressing GFAP:iGluSnFR and ClaudinK:TdTomato. In the second row, iGluSnFR(−) littermate controls are shown. The third row shows images of double transgenic fish expressing GFAP:GFAP-GFP and ClaudinK:TdTomato. Red and green channels are presented in the first and second image of each row, respectively. The third right image is a merge of both channels. Fish that express iGluSnFR appear to have reduced numbers of red-labeled OLs. Scale bar: 50 μm. (b–d) Quantification of cell numbers of total (b), dorsal (c), and ventral (d) OLs. The number of OLs was quantified by counting TdTomato(+) cells per Z-stack. Each Z-stack had the same dimensions in x, y, and z and was obtained from approximately the same region within the fish. The total number of OLs was significantly reduced in iGluSnFR-expressing fish (red dots) (b). Both regions (dorsal and ventral) show significant OL loss (c, d). However, the percentage decrease in dorsal OL numbers was higher (c). The iGluSnFR(−) (blue squares) and GFAP-Ctrl (green triangles) larvae do not show any significant difference between each other. Data were analyzed by one-way ANOVA followed by Bonferroni's multiple comparisons. *** indicates a p-value < 0.001; (b) F = 91.47; df = 80; (c) F = 80.49; df = 80; (d) F = 49.28; df = 80. Dot plots show arithmetic mean ± standard deviation. N = 3, n in iGluSnFR(+) = 34; n in iGluSnFR(−) = 32 and n in GFAP-Ctrl = 15
|
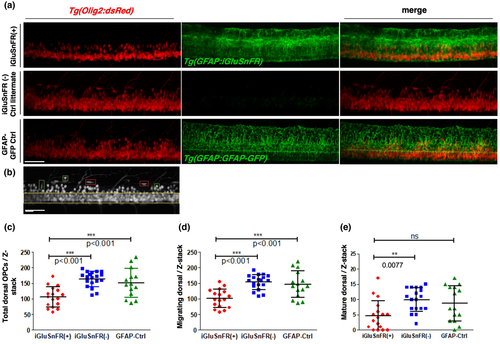
The number of Olig2(+) OPCs is reduced in iGluSnFR-expressing zebrafish at 3 dpf. (a) Z-projections of proximal spinal cord regions in lateral view obtained by two-photon microscopy. The top row shows double transgenic animals expressing Olig2:dsRed and GFAP:iGluSnFR. In the middle row, iGluSnFR(−) littermate controls are shown. The bottom row shows images of double transgenic larvae fish expressing Olig2:dsRed and GFAP:GFAP-GFP. These GFAP:GFAP-GFP fish serve as an external control for the overexpression of fluorescent proteins under the GFAP promoter, in general. Red and green channels are presented in the left and middle image of each row, respectively. The third right image shows a merged of both channels. A clear difference in dsRed(+) cell numbers (OPCs) is already visible by eye. Larvae fish that express iGluSnFR noticeably appear to have reduced numbers of labeled OPCs. Scale bar: 50 μm. (b) Example b/w image of a Tg(Olig2:dsRed) zebrafish larvae taken at a comparable spinal cord region like in (a) to demonstrate the ventral region of the spinal cord in between the two yellow lines as well as some typical more roundish or ventral-dorsal elongated “migratory OPCs” (green squares) and some typical “more mature OPCs” with a rather horizontal flat/ellipsoid shape (red squares). Scale bar: 20 μm. (c–e) Quantification of the number of dorsal OPCs. The number of dorsal OPCs was quantified by counting all dsRed+ cells above the upper ventral boarder (yellow line) per Z-stack. Each Z-stack had the same dimensions in x, y, and z and was obtained from approximately the same region in the fish. The total number of dorsal OPCs was significantly reduced in iGluSnFR-expressing fish (c). For migratory OPCs (green squares in b), we also observed a significant reduction in iGluSnFR-expressing fish compared to both controls (d). Concerning the more mature OPCs (red squares in b), we only found a significant reduction when comparing the iGluSnFR-expressing fish with iGluSnFR(−) littermate controls (e). The iGluSnFR(−) and GFAP-Ctrl larvae do not show any significant difference between them. Data were analyzed by one-way ANOVA followed by Bonferroni's multiple comparisons. *** indicates a p-value < 0.001. ** indicates a p-value < 0.01; (c) F = 13.66; df = 49; (d) F = 13.75; df = 50; (e) F = 5.413; df = 49. Dot plot graphs show arithmetic mean ± standard deviation. N = 3, n in iGluSnFR(+) = 17; n in iGluSnFR(−) = 19 and n in GFAP-Ctrl = 14
|
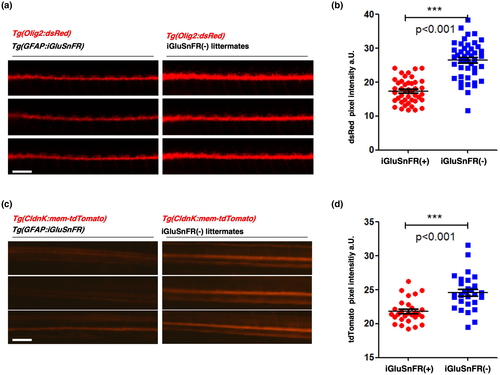
Analysis of fluorescent OPC and myelin reporter intensities. The finding that iGluSnFR-expressing zebrafish larvae shows a reduction in dorsal Olig2(+) cells at 3 dpf (see Figure 2c) could be replicated and extended to ventral cells of the proximal region of the spinal cord by examination of global Olig2:dsRed fluorescence intensities. (a) Low-resolution epi-fluorescence microscopic images of proximal zebrafish spinal cords in lateral view. Olig2:dsRed and GFAP:iGluSnFR double transgenic fish at 3 dpf on the left and only Olig2:dsRed-expressing siblings are depicted on the right (red channel only). Scale bar: 100 μm. (b) Quantification of relative Olig2:dsRed fluorescence intensities as a parameter for cell numbers. Data were analyzed by an unpaired two-tailed t test. *** indicates a p-value < 0.001; t = 9.208. The dot plot graph shows the arithmetic mean ± standard deviation. N = 3, n in iGluSnFR(+) = 43 (red dots), n in iGluSnFR(−) = 45 (blue squares). (c) Expression of CldnK is decreased in iGluSnFR(+) larvae at 5 dpf compared to controls. CldnK linked to red fluorescent expression in Tg(CldnK:mem-TdTomato) zfl is considerably high in control littermate larvae which do not express iGluSnFR (right) compared to Tg(CldnK:mem-TdTomato) Tg(GFAP:iGluSnFR) double transgenic larvae (left) at 5 dpf. (d) As a marker for myelination, the relative expression of ClaudinK:mem-TdTomato fluorescence intensities was measured and showed a considerable decrease in iGluSnFR(+) (red dots) larvae versus littermate iGluSnFR(−) controls (blue squares). The fluorescence level (pixel intensity) of the proximal spinal cord of each larva was quantified within the same area and same microscopy settings. Dot plot graphs show averaged values of pixel density areas (mean ± StDev) Data were analyzed by an unpaired two-tailed t test. p-Values are significant ***p < 0.001; t = 4.597; N = 2 independent experiments with a total of 56 larvae (n)
|
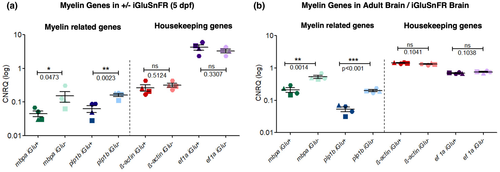
mRNA expression of myelin-related genes is significantly decreased in iGluSnFR-expressing 5 dpf zebrafish larvae and adult brains. (a) Logarithmic representation of calibrated normalized relative quantity (CNRQ) values showing mRNA quantification of the myelin genes mbpa: 0.045 ± 0.009 versus 0.152 ± 0.053 green; p = 0.0473; t = 1.984 and plp1b: 0.06 ± 0.01 versus 0.16 ± 0.01; blue; p = 0.0023; t = 4.378 together with the housekeeping genes ß-actin: 0.27 ± 0.06 versus 0.32 ± 0.04; red; p = 0.512; t = 0.6962 and ef1a: 4.23 ± 0.77 versus 3.32 ± 0.40; purple; p = 0.3307; t = 1.058; isolated from iGluSnFR-expressing 5 dpf larvae in comparison to iGluSnFR(−) siblings, respectively. mRNA levels were normalized against ß-actin and ef1a housekeeping gene expression. Each color (dark for iGluSnFR(+) and light for iGluSnFr(−)) represents a different gene, each shape represents an independent experiment. Data were analyzed by an unpaired two-tailed t test; * indicates a p-value < 0.05; ** indicates a p-value < 0.01; *** indicates a p-value < 0.001. The housekeeping genes ß-actin and ef1a do not show any significant difference whether iGluSnFR is expressed (+) or not (−). Values show mean ± SEM. N = 4 independent experiments as indicated by different shapes. (b) mRNA expression of myelin-related genes is decreased significantly in iGluSnFR-expressing adult fish brain compared to WT littermate brain. As for the larvae fish in (a) logarithmic representation of CNRQ values showing mRNA quantification of the following genes: mbpa: 0.21 ± 0.03 versus 0.53 ± 0.05; p = 0.0014; t = 4.860 plp1b: 0.05 ± 0.009 versus 0.20 ± 0.01; p < 0.001; t = 8.281; ß-actin: 1.44 ± 0.03 versus 1.33 ± 0.04; p = 0.1041; t = 1.914 and ef1a: 0.69 ± 0.02 versus 0.75 ± 0.02; p = 0.1038; t = 1.916. This time though isolated from iGluSnFR-expressing adult fish brain compared to control WT littermate brains, and not from larvae fish. mRNA levels were normalized against ß-actin and ef1a housekeeping genes expression. Both housekeeping genes do not show any significant difference when iGluSnFR is expressed compared to WT brain controls. Again, each color represents a different gene, each shape represents an independent experiment. Data were evaluated by t test. Values show mean ± SEM. N = 4 independent experiments as indicated by different shapes
|
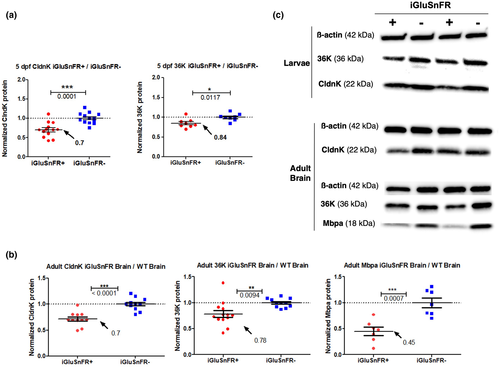
Protein expression of myelin-related genes is significantly decreased in iGluSnFR-expressing 5 dpf zebrafish larvae and adult brains. (a) The expression of the myelin proteins CldnK (left) and 36K (right) is significantly decreased in iGluSnFR-expressing 5 dpf larvae (red), which is compared to iGluSnFR(−) littermate controls (blue). For both proteins, the ratio of iGluSnFR(+)/iGluSnFR(−) expression was calculated for each experiment and normalized against the average values of iGluSnFR(−) expression, which was thus set to one in average, as shown. Dot plot graphs are averaged (values shown in graphs) of pixel density areas of the according Western blot bands (mean ± StDev). Data were analyzed by an unpaired two-tailed t test. p-Values are significant ***p < 0.0001; **p < 0.001; *p < 0.05; CldnK: p = 0.0001; t = 4.500; 36K: p = 0.0117; t = 2.897; N = 4 independent experiments. (b) Normalized expression of the myelin proteins CldnK (left), 36K (middle), and Mbpa (right) are significantly decreased in iGluSnFR-expressing adult brains (red) compared to controls (WT brains; blue). As above for the zfl for all protein expression quantification, the ratio of iGluSnFR(+) brain/WT iGluSnFR(−) expression was calculated and normalized against the average values of iGluSnFR(−) expression (see methods section for details of calculations). Dot plot graphs show averaged values of pixel density areas of the according Western blot bands (mean ± StDev). Data were analyzed by an unpaired two-tailed t test. CldnK: p < 0.0001; t = 5.522; 36K: p = 0.0094; t = 2.848; Mbpa: p = 0.0007; t = 4.496. N = 3 Independent experiments. (c) Representative Western blot protein expression bands of 36K, CldnK, Mbpa, and ß-actin from 5 dpf zfl (upper panel) and adult brains (lower panel). For complete Western blot membranes, please refer to Figure S2 (zfl) and Figure S3 (adult brain)
|
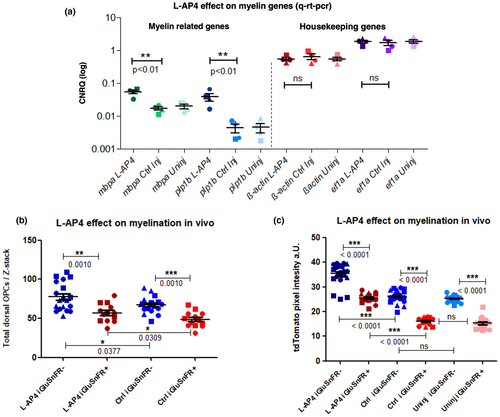
Treatment with the mGluR agonist L-AP4 increased myelin-related genes and rescues CNS myelination in iGluSnFR(+) zfl. (a) CNRQ values representing mRNA quantification of mbpa, plp1b, ß-actin, and ef1a isolated from 1mM L-AP4, sham vehicle-injected and untreated zfl (wild type) at 5 dpf (injected at 3 dpf). mRNA levels were normalized against ß-actin and ef1a housekeeping gene expression. Both myelin genes, mbpa and plp1b, show a significant increase in expression in L-AP4 injected zfl compared to sham-injected or uninjected control larvae. Both housekeeping genes though do not show any significant difference in L-AP4 versus sham-injected or uninjected controls. Data were evaluated by one-way ANOVA followed by Bonferroni's multiple comparisons. * indicates a p-value < 0.05; ** indicates a p-value < 0.01. Values show mean ± SEM. mbpa: L-AP4 versus Ctrl **p < 0.01; L-AP4 versus uninj. **p < 0.01; F = 18.60; df = 11 and plp1b: L-AP4 versus Ctrl **p < 0.01; L-AP4 versus uninj. **p < 0.01; F = 10.74; df = 11; ß-actin: L-AP4 versus Ctrl p = 0.6673; L-AP4 versus uninj.: p = 0.6673; F = 0.4233; df = 11 and ef1a: L-AP4 versus Ctrl p = 0.8338; L-AP4 versus uninj. p = 0.8338; F = 0.1855; df = 11. N = 4 independent experiments indicated by different shapes. (b) Two-photon in vivo microscopic images of Tg(Olig2:dsRed) proximal zfl spinal cords of 5 dpf larvae after L-AP4 ventricle injections at 3 dpf where analyzed in lateral view. For representative example images, please refer to Figure S6a. A significant increase in total dorsal OPCs after L-AP4 injection could be seen in iGluSnFR(−) zfl compared to sham-injected iGluSnFR(−) larvae. *p = 0.0377; unpaired two-tailed t test; t = 2.158. iGluSnFR(+) zfl at 5 dpf like before at 3 dpf (see Figure 2) showed a significant ***p = 0.001; unpaired two-tailed t test; t = 3.643 decrease in dorsal OPCs compared to iGluSnFR(−) zfl. Injection of 1mM L-AP4 at 3 dpf into the ventricle of iGluSnFR(+) zfl though could partly but significantly *p = 0.0309; unpaired t test; t = 1.959 rescue the OPC reducing effect of iGluSnFR at 5 dpf. Dot plot graphs show averages of dorsal OPC numbers (mean ± StDev). N = 3 independent experiments indicated by different shaped dots, with a total (n) of 13–19 larvae. (c) Low-resolution epi-fluorescence microscopic images of Tg(CaudinK:mem-TdTomato) proximal zfl spinal cords of 5 dpf larvae after L-AP4 or sham ventricle injections at 3 dpf where analyzed in lateral view. For representative example images, please refer to Figure S6b. A significant increase in tdTomato red myelin reporter fluorescence after L-AP4 injection could be seen in iGluSnFR(−) zfl compared to sham-injected iGluSnFR(−) larvae ***p < 0.0001; one-way ANOVA followed by Bonferroni's multiple comparisons; F = 82.24; df = 69. The same is true for a comparison with completely uninjected iGluSnFR(−) siblings. Control iGluSnFR(+) zfl at 5 dpf like before (see Figure 3c) showed a significant ***p < 0.0001; unpaired two-tailed t test; t = 9.378; decrease in tdTomato reporter fluorescence compared to control iGluSnFR(−) zfl. Injection of 1mM L-AP4 at 3 dpf into the ventricle of iGluSnFR(+) zfl though could completely and significantly ***p < 0.0001; rescue this myelin-reducing effect of iGluSnFR at 5 dpf; one-way ANOVA followed by Bonferroni's multiple comparisons; F = 172.2; df = 54. Dot plot graphs show averages of red tdTomato myelin reporter fluorescence (mean ± StDev). N = 3 independent experiments indicated by different shaped dots, with a total (n) of 15–17 larvae
|
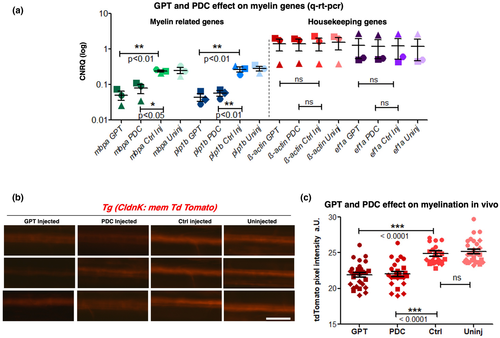
Glutamate degrading and blockade of glutamate uptake significantly decreased myelin-related genes and myelination. (a) After zfl ventricle injections at 3 dpf with the Glutamate-Pyruvate-Transaminase (GPT) and the glutamate transport inhibitor L-trans-pyrrolidine-2,4-dicarboxylate (PDC), CNRQ values representing mRNA quantification of mbpa, plp1b, ß-actin, and ef1a genes were analyzed. Data are from 10 U/ml GPT + 50 µM Pyruvate, 2 mM PDC, sham vehicle-injected and untreated zebrafish larvae (wild type, 5 dpf). The housekeeping genes ß-actin and ef1a do not show any significant difference. mRNA levels could therefore be normalized against ß-actin and ef1a housekeeping gene expression. For both pharmacological treatments supposed to reduce extracellular glutamate, we could find a significant decrease of the myelin-related genes mbpa and plp1b in 5 dpf zfl. Data were evaluated by one-way ANOVA followed by Bonferroni's multiple comparisons to compare the means among the four groups. ** indicates a p-value < 0.01; *** indicates a p-value < 0.001. Values show mean ± SEM. N = 3 independent experiments indicated by different shaped dots. (b) Low-resolution epi-fluorescence microscopic images of 5 dpf Tg(ClaudinK:mem-TdTomato) zfl spinal cords in lateral view demonstrate in vivo decrease of myelination after injections of GPT and PDC at 3 dpf. Clear decrease in myelination in 10 U/ml GPT + 50 µM Pyruvate treated larvae (left column) and 2 mM PDC-treated larvae (second from left) could be seen compared to sham vehicle-injected (second from right) or uninjected larvae (right) controls by examination of ClaudinK:mem-TdTomato fluorescence intensities as direct myelin reporter. Scale bar 50 µm. (c) Quantification of relative CldnK:mem-TdTomatof fluorescence intensities as a parameter for myelination. Images of all experiment were acquired under the same microscopy settings. The fluorescence level (pixel intensity) of the proximal spinal cord of each fish was quantified at the same selected region. Both 10 U/ml GPT + 50 µM Pyruvate and 2 mM PDC injected larvae show a significant decrease in myelination compared to the sham vehicle-injected control or the uninjected control. While no difference is seen between uninjected versus vehicle-injected larvae. Dot plot graphs show average values of pixel density areas as mean ± StDev. p-values are significant ***p < 0.001; one-way ANOVA followed by Bonferroni's multiple comparisons. N = 3 independent experiments with a total of 90 to 110 larvae (n). Each dot shape indicates the identity of a certain data point to the appropriate experiment (N)
|