
FIGURE 4
- ID
- ZDB-FIG-221109-52
- Publication
- Xing et al., 2022 - Regulatory factor identification for nodal genes in zebrafish by causal inference
- Other Figures
- All Figure Page
- Back to All Figure Page
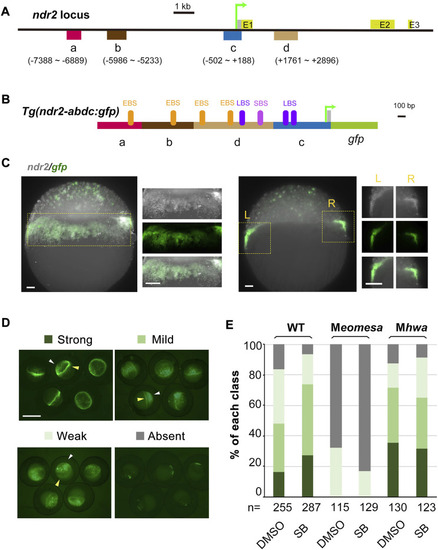
Verification of ndr2 cis-regulatory regions through transient transgenic assay. (A–C) Genomic organization of ndr2 locus (A) and composition of transgenes (B) with specific gfp expression mimicking endogenous ndr2 (C). The translation start site was designated as position +1. Exons (E) of ndr2 were indicated. EBS, Eomes-binding site; LBS, Lef/β-catenin binding site; SBS, Smad2-binding site. Wild-type embryos were injected with 50 pg Tg(ndr2-abdc:gfp) and harvested at about 30% epiboly stage for detection of ndr2 and gfp expression pattern by FISH. Lateral views (the left panel) and vertical sections (the right panel) with magnification (indicated in the yellow rectangle) were shown. Scale bars: 50 μm. (D–E) Categorization of ndr2 transgenes in zebrafish embryos. Tg(ndr2-abdc:gfp) DNA was injected into one-cell stage WT or mutant embryos (50 pg/embryo), and GFP was observed at 4.3–5 hpf. The embryo treatment and data presentation were similar to those described in Figure 3C and 3D. |