
FIGURE 1
- ID
- ZDB-FIG-221109-49
- Publication
- Xing et al., 2022 - Regulatory factor identification for nodal genes in zebrafish by causal inference
- Other Figures
- All Figure Page
- Back to All Figure Page
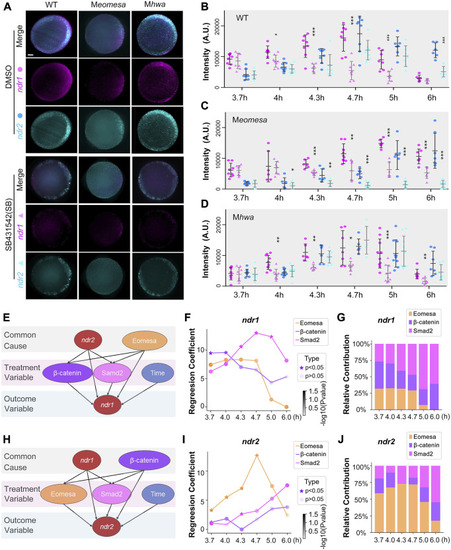
Regulatory factors of ndr1 and ndr2 analyzed by a causal graphical model. (A–D) Dynamic fluorescence intensities of ndr1 and ndr2 quantified for model analysis. (A) Representative expression pattern of ndr1 and ndr2 at 4.7 hpf detected by double fluorescence in situ hybridization (FISH). Embryos were treated with 1% DMSO or 50 μM SB431542 (SB) and fixed at indicated stages. All embryos are shown in animal-pole view with dorsal to the right; the dorsal is indicated by the expression pattern of ndr1/ndr2. It is of note that under SB treatment, the ndr1, not ndr2, could be detected in Meomesa embryos, while both ndr1 and ndr2 were present in Mhwa embryos. Scale bars, 100 μm. (B–D) Quantification of fluorescence intensities of ndr1 and ndr2 at indicated stages. In total, 7–10 embryos for each group were measured by Fiji for the total intensities. Pink dots, ndr1 intensities; blue dots, ndr2 intensities (circles for the DMSO group, and triangles for the SB group). It is of note that in Meomesa treated with DMSO, ndr2 intensities rise following the intensity increase of ndr1. Error bars represent s.d. for all embryos in each group. The asterisks show a significant difference between the SB group and the DMSO group. *p < 0.05; **p < 0.01; ***p < 0.001; not shown, not significant. (E–G) Hwa/β-catenin and Nodal/Smad2 could be the treatment variable factors for ndr1 expression during the time series. (E) Causal graphical model for ndr1 expression level. The causal inference was used to evaluate the causal between independent and dependent variables based on the linear regression model. The p-value of the regression coefficient of the independent variable (Eomesa) > 0.2 has no significant effect on the dependent variable ndr1, while the p-value of the regression coefficient of the independent variable (Hwa/β-catenin, Nodal/Smad2) < 0.2, indicating that these factors have a high contribution in the expression of ndr1. (F) The regression coefficient of Eomesa, β-catenin, and Smad2 on ndr1 at different time points. The p-value<0.5 was marked as a star. All coefficients were scaled down by a factor of 1000 for visualization. (G) The relative contribution of factors to ndr1 at different time points. (H–J) Eomesa and Smad2 could be the treatment variable factors for ndr2 expression during the time series. The data presentation was similar to those described in (E–G). |