
FIGURE 2
- ID
- ZDB-FIG-221109-50
- Publication
- Xing et al., 2022 - Regulatory factor identification for nodal genes in zebrafish by causal inference
- Other Figures
- All Figure Page
- Back to All Figure Page
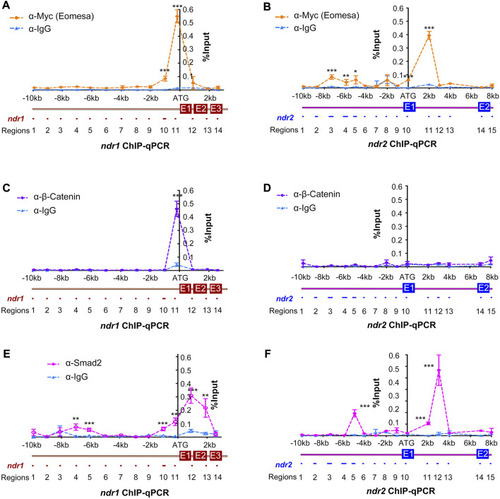
Identification of binding regions in ndr1 and ndr2 loci for Eomesa, β-catenin, and Smad2. Uninjected WT embryos or those injected with 50 pg Myc-eomesa mRNA were harvested at 4.3–5 hpf for chromatin immunoprecipitation using anti-Myc (A and B), anti-β-catenin (C and D), anti-Smad2 (E and F), or IgG antibody (Ab). The immunoprecipitated chromatin was used for quantitative PCR analysis using specific primers targeting different regions, as illustrated. The PCR results were normalized with the input genomic DNA with dilution factor (e.g., 1:10). The x-axis showed the genomic organization of ndr1 or ndr2 with amplified regions numbered. The translation start site was designated as position +1. The y-axis indicated the average percentage (±SEM) of amplified product relative to input DNA (% input) based on two independent experiments. Statistical significance levels: *, p < 0.05; **, p < 0.01; ***, p < 0.001; ns, nonsignificant. |