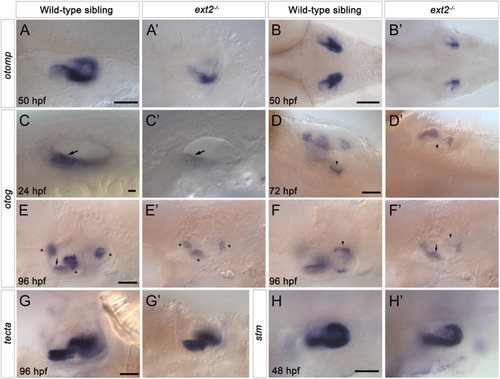
Expression of otomp, otog and stm is reduced in the saccular macula of the ext2−/− mutant ear. (A–H’)In situ hybridisation to otolith marker genes in the ears of phenotypically wild-type sibling and ext2 mutant embryos. (A–B’) Levels of otomp expression in the ext2 mutant ear (A’,B’) at 50 hpf were reduced compared with the wild type (A,B). (C–F’) Expression of otog at 24 hpf (C,C’), 72 hpf (D,D’), and 96 hpf (E-F’) was significantly reduced in the ext2 mutant ear. The images in (F,F’) show a more medial focal plane of the same ears depicted in (E,E’), respectively. (G,G’) Expression of tecta in the ext2 mutant ear was unaltered at 96 hpf. (H,H’) Expression of stm expression at 48 hpf was reduced in the posterior macula (arrowhead) of the ext2 mutant ear. Arrowheads mark the posterior (saccular) macula; arrows mark the anterior (utricular) macula; asterisks mark the cristae. All images are lateral views with anterior to the left, apart from (B,B’,D,D’) (dorsal views with anterior to the left). In all panels, anterior is to the left. Scale bars: in (A), 50 μm for (A’); in (B), 100 μm for (B’); in (C), 10 μm for (C’); in (D), 50 μm for (D’); in (E), 50 μm for (E’–F’); in (G), 50 μm for (G’); in (H), 50 μm for (H’).
|
