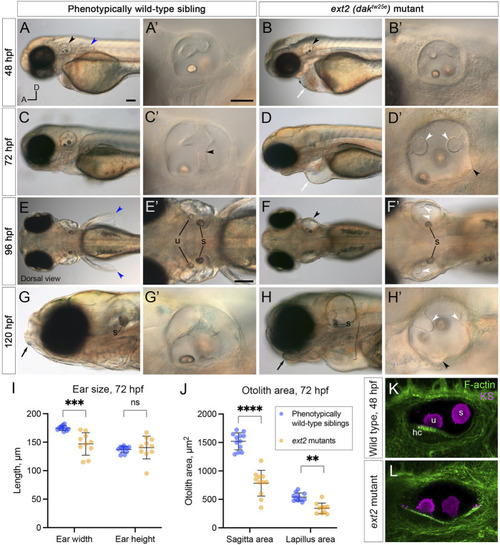
Morphological defects in the inner ear of ext2 mutant embryos. (A–H’) Live DIC images of phenotypically wild-type sibling and ext2 homozygous mutant embryos at 48–120 hpf. The otic vesicle (enlarged in the second and fourth columns) is marked with a black arrowhead in (A,B,F). Note the absence of the pectoral fin bud [(A,E), blue arrowheads in wild type], cardiac oedema [(B,D), white arrows], and abnormal jaw [(G,H), black arrows] in the mutant. At 72 hpf, epithelial projections have fused and formed pillars in the wild-type ear [black arrowhead in (C’) marks the fusion plate of the ventral pillar], whereas in the ext2 mutant ear, the projections stayed small and often did not fuse [white arrowheads, (D’,F’,H’)]. Black arrowheads in (D’) and (H’) mark abnormal out-pocketings of the epithelium. Scale bars: (A), 100 μm [also applies to (B,C,D,E,F,G,H)]; (A’), 50 μm [also applies to (B’,C’,D’,G’,H’)]; (E’), 100 μm [also applies to (F’)]. All panels are lateral views with anterior to the left (orientation shown in (A): A, anterior; D, dorsal), apart from (E–F’) (dorsal views, anterior to the left). (I,J) Morphometric measurements of ear width and height (I), and otolith area (J), traced from micrographs at 72 hpf [N = 6 embryos, n = 12 ears of each genotype (some data points missing)]. See Supplementary Figure S2 for details. Horizontal bars show mean +/− standard deviation. Two-way ANOVA (mixed-effects model) with Šídák’s correction for multiple comparisons: ns, not significant; **p = 0.0082; ***p = 0.0008; ****p < 0.0001. (K,L) Ears at 48 hpf, stained with Alexa phalloidin (green) and an antibody to keratan sulphate (magenta). Abbreviations: hc, hair cells in the utricular macula; s, saccular otolith (sagitta); u, utricular otolith (lapillus).
|
