
- Title
-
Presence of chondroitin sulphate and requirement for heparan sulphate biosynthesis in the developing zebrafish inner ear
- Authors
- Jones, A.A., Diamantopoulou, E., Baxendale, S., Whitfield, T.T.
- Source
- Full text @ Front Cell Dev Biol

Staining for chondroitin sulphate in phenotypically wild-type zebrafish ears marks sites of epithelial projection outgrowth. |
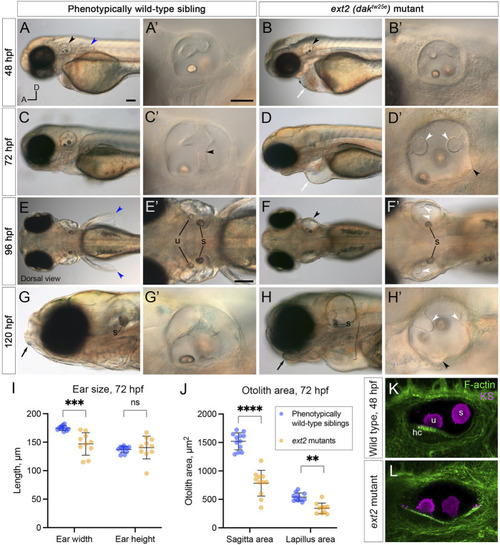
Morphological defects in the inner ear of |

Expression of |
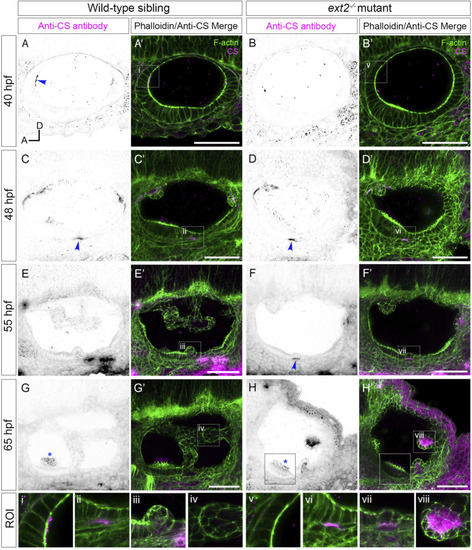
Staining for chondroitin sulphate in the |
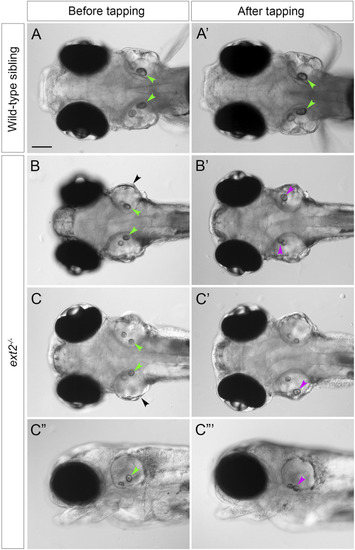
Saccular otoliths are not tethered correctly in the homozygous PHENOTYPE:
|
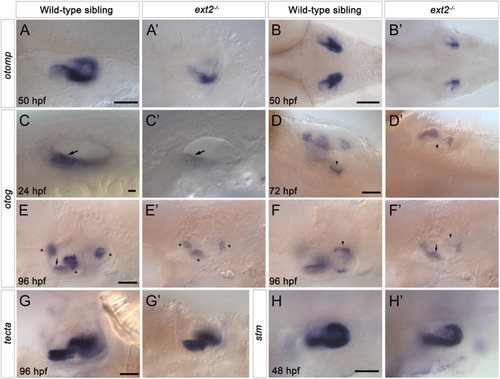
Expression of |