|
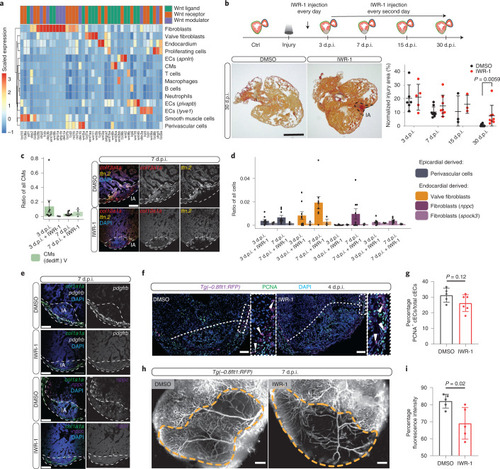
Cellular dissection of the role of canonical Wnt signalling.a, Expression of Wnt signalling factors in different cell types of the zebrafish regenerating heart. b, Upper panel: cartoon summary of IWR-1 Wnt inhibition experiments. Lower left: histological comparison of the IA at 30 d.p.i. with intraperitoneal (IP) injections of IWR-1 or DMSO. In the paraffin AFOG-stained sections, fibrin-red and collagen-blue are clearly visible in the IA in IWR-1-treated samples at 30 d.p.i. Scale bar, 300 μm. Lower right: relative size of the IA area as a percentage across all histological replicates; data shown as mean and s.d. Two-tailed unpaired Student’s t test between groups at each time point, P = 0.0059. c, Left: changes in relative numbers of dedifferentiated CMs at 3 and 7 d.p.i. between IWR-1- and DMSO-treated hearts (error bars indicate s.e.m.). Right: localization of dedifferentiated (ttn.2) cardiomyocytes at 7 d.p.i. with and without Wnt inhibition. Scale bar, 100 μm. d, Changes in relative numbers of non-CMs following Wnt inhibition at 3 and 7 d.p.i. (error bars indicate s.e.m.). e, Fluorescence in situ hybridization of perivascular cells (pdgfrb, white) and nppc fibroblasts (nppc, purple) at 7 d.p.i. with and without Wnt inhibition. Scale bar in c and e, 100 μm. White dashed lines indicate the IA. f, Immunostaining of Tg(-0.8flt1:RFP) hearts at 4 d.p.i. with and without Wnt inhibition; RFP (coronaries, magenta), PCNA (proliferation marker, green) and DNA (DAPI, blue). Arrowheads point to PCNA+ cECs, white dashed lines indicate the IA. Scale bar, 100 μm. g, Percentages of PCNA+ cECs in DMSO-injected (n = 5) and IWR-1-injected (n = 6) fish at 4 d.p.i. Data are shown as mean and s.d. Two-tailed unpaired Student’s t test, P = 0.12. h, Whole-mount images of Tg(-0.8flt1:RFP) hearts at 7 d.p.i. with and without Wnt inhibition. Orange dashed lines indicate injury area. Scale bar, 100 μm. i, Percentages of RFP fluorescence intensity in injured tissue of DMSO-injected (n = 5) and IWR-1-injected (n = 5) fish at 7 d.p.i. Data are shown as mean and s.d. Two-tailed unpaired Student’s t test, P = 0.02. Source data
|