FIGURE SUMMARY
Title

Origin and function of activated fibroblast states during zebrafish heart regeneration

Authors
Hu, B., Lelek, S., Spanjaard, B., El-Sammak, H., Simões, M.G., Mintcheva, J., Aliee, H., Schäfer, R., Meyer, A.M., Theis, F., Stainier, D.Y.R., Panáková, D., Junker, J.P.
Source
Full text @ Nat. Genet.

The cellular composition of the regenerating heart.

a, Cartoon of the experimental approach. Cells were barcoded with indels (insertions or deletions) during early development, and fish were raised to adulthood. Hearts were harvested either as an uninjured control or at 3, 7 or 30 d.p.i. b, UMAP representation of single-cell RNA-seq data and clustering results. Pie charts show the proportions of different cell types at different time points after injury. In the pie chart representation, similar cell types are grouped and shown by one (representative) colour. Asterisks denote cell types with a statistically significant change in proportions compared with uninjured controls. c, Mapping of single-cell data onto a spatially resolved tomo-seq data set. A computational deconvolution approach revealed chamber-specific cell subtypes. d, Distribution of subtypes of cardiomyocytes (CMs), endocardial cells and epicardial cells for scRNA-seq data sets in which atrium and ventricle were physically separated. Colour scheme as in Supplementary Fig. 3.

Source data

Cell type diversity of cardiac fibroblasts.

a, Left: relative changes in abundance of different subtypes of CMs across the time points (n = 3, 9, 9, 5 animals; error bars show s.e.m.). Right: differentially expressed genes between subtypes of CMs. b, Comparison of average normalized expression of known proregenerative factors in fibroblasts and other cell types. The comparison used data pooled over all time points, and fibroblasts were defined as all cells in the yellow cluster in Fig. 1b. c, UMAP representation of the subclustering of col1a1a-expressing cells. d, Expression of ECM-related genes in different fibroblast cell types. The genes were classified according to their contribution to structure, breakdown or interaction of the ECM. A, atrium; Ctrl., control; const., constitutive; dediff., dedifferentiated; prolif., proliferating; V, ventricle.

Source data

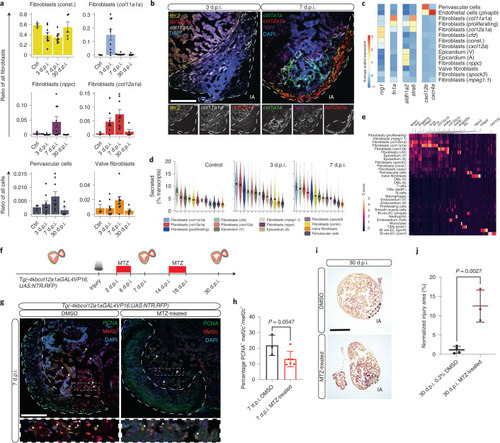
Identification of proregenerative cardiac fibroblasts.

a, Cell number dynamics of selected fibroblast subclusters across the time points (n = 3, 9, 9, 5 animals; error bars show s.e.m.). b, Fluorescence in situ hybridization of marker genes. Left panel: const. fibroblasts (green), col12a1a fibroblasts (red) and nppc fibroblasts (purple) at 7 d.p.i. Right panel: col12a1a fibroblasts (red), col11a1a fibroblasts (white) and dedifferentiated CMs expressing ttn.2 (yellow) at 3 d.p.i. Injury areas (IA) are indicated with a dashed white line. Scale bar, 100 μm. c, Average expression of selected signalling genes in fibroblast subclusters. Blood vessel endothelial cells are included to show their interaction with perivascular cells via Cxcl12b–Cxcr4a signalling. d, Mean secretome expression of fibroblast cell types (n = 1,947, 8,611 and 17,261 cells; error bars indicate 3 × s.e.m.; y axis truncated for readability; full plots in Supplementary Fig. 10a). e, Differentially expressed secretome genes at 3 d.p.i. Genes with a reported function in regeneration, morphogenesis, tissue development or angiogenesis are highlighted (Bl. ves. EC: Blood vessel endothelial cells). f, Schematic of the ablation experiment for col12a1a-expressing cells. g, Immunostaining of sections of cryoinjured hearts of Tg(-4kbcol12a1aGAL4VP16;UAS:NTR:RFP) zebrafish treated with DMSO and MTZ at 7 d.p.i.; sections stained for Mef2c (CMs, red), PCNA (proliferation marker, green) and DNA (DAPI, blue). Arrowheads point to PCNA+ CMs; white dashed lines indicate IA. Scale bar, 100 μm. h, Percentages of PCNA+ CMs in DMSO-treated fish (n = 3) and MTZ-treated fish (n = 6) at 7 d.p.i. n represents biologically independent samples from two independent experiments. Data are shown as mean and s.d. Two-tailed unpaired Student’s t test, P = 0.0547. i, Histological comparison of the IA at 30 d.p.i. with and without MTZ treatment. Scale bar, 300 μm. j, Relative size of the IA across all histological replicates at 30 d.p.i. in 0.2% DMSO- (n = 4) and MTZ-treated (n = 3) samples. n represents biologically independent samples from two independent experiments. Data are shown as mean and s.d. Two-tailed unpaired Student’s t test, P = 0.0027.

Source data

Identification of epicardial fibroblasts.

a, Cartoon of lineage tree construction using LINNAEUS. b, Weighted correlations of cell types over the tree were calculated to quantify lineage similarity. c,d, Clustering by lineage correlations at 3 d.p.i. (c) and 7 d.p.i. (d) revealed the epicardial origin of many niche fibroblasts. e, Cre–lox lineage tracing confirmed the epicardial origin of col12a1a-expressing cells. Scale bar, 100 μm. f, Trajectory analysis suggested constitutive fibroblasts as the source of col11a1a and col12a1a fibroblasts at 3 d.p.i.

Source data

Identification of endocardial fibroblasts.

a, Clone-independent transitions (for example 50%, top) showed similar transition rates across clones, leading to a strong correlation between yellow and blue cell types. Clone-dependent transition rates (for example 30% and 80%, bottom) caused yellow and blue cell types to lose correlation, requiring a different approach for lineage analysis. b, Conditional cell type probabilities could pinpoint lineage origins despite clone-dependent transitions. c, Conditional probabilities reproduced the epicardial lineage origin of col12a1a fibroblasts. d, Endocardial cell types were present in more than 80% of all nodes containing nppc, spock3 and valve fibroblasts. Asterisks in c and d indicate the queried cell type. e, Cre–lox lineage tracing confirmed the endocardial origin of nppc-expressing fibroblasts in cryoinjured hearts at 7 d.p.i. Sections were stained for GFP (green) and nppc (magenta). Arrowheads point to nppc and EGFP colocalization. Asterisks point to nppc-positive delaminating cells. Scale bar, 100 μm. f, Trajectory analysis revealed a potential transition from endocardial cells to nppc fibroblasts. g, Venn diagram of upregulated genes in nppc fibroblasts compared with activated endocardium (7 d.p.i.).

Source data

Cellular dissection of the role of canonical Wnt signalling.

a, Expression of Wnt signalling factors in different cell types of the zebrafish regenerating heart. b, Upper panel: cartoon summary of IWR-1 Wnt inhibition experiments. Lower left: histological comparison of the IA at 30 d.p.i. with intraperitoneal (IP) injections of IWR-1 or DMSO. In the paraffin AFOG-stained sections, fibrin-red and collagen-blue are clearly visible in the IA in IWR-1-treated samples at 30 d.p.i. Scale bar, 300 μm. Lower right: relative size of the IA area as a percentage across all histological replicates; data shown as mean and s.d. Two-tailed unpaired Student’s t test between groups at each time point, P = 0.0059. c, Left: changes in relative numbers of dedifferentiated CMs at 3 and 7 d.p.i. between IWR-1- and DMSO-treated hearts (error bars indicate s.e.m.). Right: localization of dedifferentiated (ttn.2) cardiomyocytes at 7 d.p.i. with and without Wnt inhibition. Scale bar, 100 μm. d, Changes in relative numbers of non-CMs following Wnt inhibition at 3 and 7 d.p.i. (error bars indicate s.e.m.). e, Fluorescence in situ hybridization of perivascular cells (pdgfrb, white) and nppc fibroblasts (nppc, purple) at 7 d.p.i. with and without Wnt inhibition. Scale bar in c and e, 100 μm. White dashed lines indicate the IA. f, Immunostaining of Tg(-0.8flt1:RFP) hearts at 4 d.p.i. with and without Wnt inhibition; RFP (coronaries, magenta), PCNA (proliferation marker, green) and DNA (DAPI, blue). Arrowheads point to PCNA+ cECs, white dashed lines indicate the IA. Scale bar, 100 μm. g, Percentages of PCNA+ cECs in DMSO-injected (n = 5) and IWR-1-injected (n = 6) fish at 4 d.p.i. Data are shown as mean and s.d. Two-tailed unpaired Student’s t test, P = 0.12. h, Whole-mount images of Tg(-0.8flt1:RFP) hearts at 7 d.p.i. with and without Wnt inhibition. Orange dashed lines indicate injury area. Scale bar, 100 μm. i, Percentages of RFP fluorescence intensity in injured tissue of DMSO-injected (n = 5) and IWR-1-injected (n = 5) fish at 7 d.p.i. Data are shown as mean and s.d. Two-tailed unpaired Student’s t test, P = 0.02.

Source data

Acknowledgments
This image is the copyrighted work of the attributed author or publisher, and ZFIN has permission only to display this image to its users. Additional permissions should be obtained from the applicable author or publisher of the image. Full text @ Nat. Genet.