|
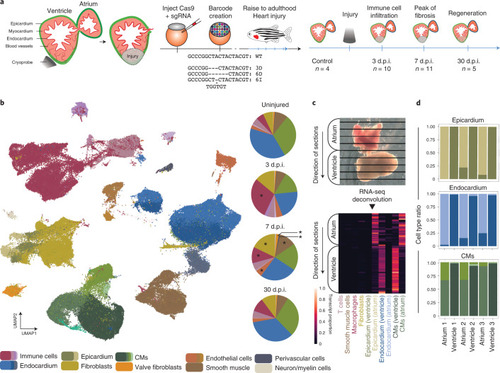
The cellular composition of the regenerating heart.a, Cartoon of the experimental approach. Cells were barcoded with indels (insertions or deletions) during early development, and fish were raised to adulthood. Hearts were harvested either as an uninjured control or at 3, 7 or 30 d.p.i. b, UMAP representation of single-cell RNA-seq data and clustering results. Pie charts show the proportions of different cell types at different time points after injury. In the pie chart representation, similar cell types are grouped and shown by one (representative) colour. Asterisks denote cell types with a statistically significant change in proportions compared with uninjured controls. c, Mapping of single-cell data onto a spatially resolved tomo-seq data set. A computational deconvolution approach revealed chamber-specific cell subtypes. d, Distribution of subtypes of cardiomyocytes (CMs), endocardial cells and epicardial cells for scRNA-seq data sets in which atrium and ventricle were physically separated. Colour scheme as in Supplementary Fig. 3. Source data
|