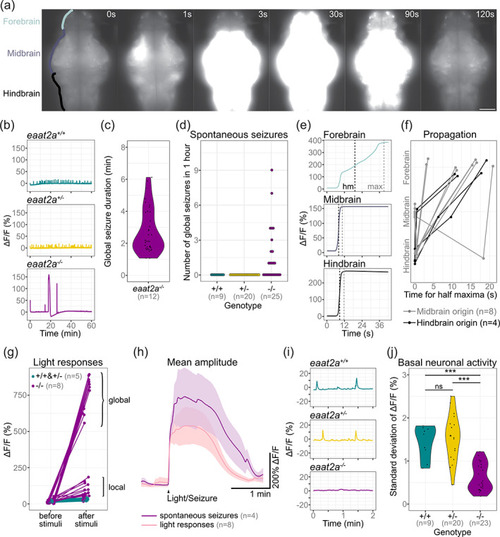
Neuronal hyperactivity during seizures contrasts with basal hypoactivity in eaat2a −/− larvae. (a) Time lapse of neuronal calcium signals during a seizure in a eaat2a −/− larva in Tg(elavl3:GCaMP5G) background (dorsal view). Scale bar is 100 μm. (b) Representative calcium signals (elavl3:GCaMP5G) recorded across the brain of eaat2a +/+ (cyan, top), eaat2a +/− (yellow, middle) and eaat2a −/− (magenta, bottom) larvae. (c) Duration of spontaneous global seizures present in 12 out of 25 eaat2a −/− mutants (median 2 min 7 s [std ± 52 sec]). n = 36 seizures. (d) Number of spontaneous global seizures per animal recorded by calcium imaging during 60 min. (e) Neuronal activity (elavl3:GCaMP5G) of the three main brain regions of a representative global seizure. The half maxima (hm) represents the time point of max(ΔF/F0)/2. (f) Relative time for ΔF/F0 half maximum represents propagation of global seizures across brain parts over time. Each line represents the mean relative time of one eaat2a −/− larva. Colors indicate region of seizure origin: light gray for midbrain, black for hindbrain. (g) Calcium signals (elavl3:GCaMP6s) 1 min before and immediately after light stimuli. Brackets indicate global (curly brackets) and local (square brackets) reflex seizures. Five light stimuli per fish. (h) Averaged calcium signals for spontaneous seizures (magenta, seven events) and light responses (light pink, 40 events) during light‐stimuli recordings. Shaded area represents SEM. (i) Magnification of (b) shows calcium signals (elavl3:GCaMP5G) during two‐minute basal activity period used for SD calculations in (j). (j) Neuronal basal activity calculated by the SD of ΔF/F0 over 2 min in eaat2a −/− mutants (mean 0.63) compared to their eaat2a +/− (mean 1.54,) and eaat2a +/+ (mean 1.44,) siblings. Significance levels: ***p < .001, ns = not significant (p > .05), Dunn Kruskal‐Wallis multiple comparison test. All statistics in Supplementary Table 3
|
