
- Title
-
Loss of glutamate transporter eaat2a leads to aberrant neuronal excitability, recurrent epileptic seizures, and basal hypoactivity
- Authors
- Hotz, A.L., Jamali, A., Rieser, N.N., Niklaus, S., Aydin, E., Myren-Svelstad, S., Lalla, L., Jurisch-Yaksi, N., Yaksi, E., Neuhauss, S.C.F.
- Source
- Full text @ Glia
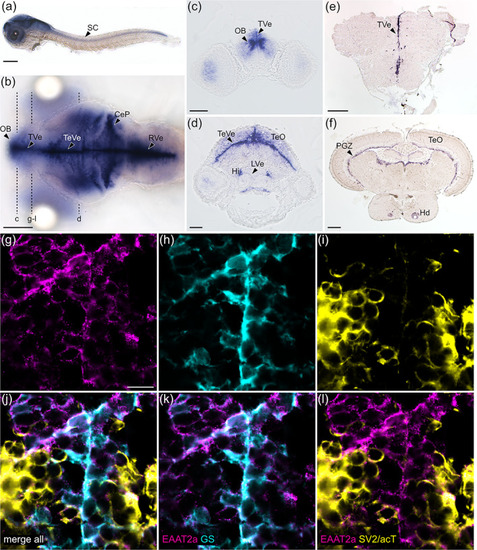
EAAT2a is predominantly expressed in astroglial cells. (a, b) mRNA of eaat2a was expressed along the periventricular zones (TVe, TeVe, RVe), resembling astroglial localization patterns in larval zebrafish as visible in lateral (a, 3 dpf) and dorsal (b, 5 dpf) view. (c, d) Cross sections of (b) indicated by dashed lines. (e, f) eaat2a mRNA expression along periventricular zones (TVe, PGZ) was maintained in adult zebrafish anterior forebrain (e) and midbrain (f). (g–i) Protein expression of EAAT2a (magenta), glutamine synthetase (GS, cyan) and synaptic vesicle 2/acetylated tubulin (SV2/acT, yellow) on cross sections of larval anterior forebrain indicated in (b). (j–l) Overlay of EAAT2a, GS and SV2/acT showed a greater co‐localization of EAAT2a with astroglial (k) than neuronal (l) cells. CeP, cerebellar plate; Hi, intermediate hypothalamus; Hd, dorsal zone of periventricular hypothalamus; LVe, lateral ventricular recess of hypothalamus; OB, olfactory bulb nuclei; PGZ, periventricular gray zone of the optic tectum; TVe, periventricular zone of the telencephalon; TeO, optic tectum; TeVe, periventricular zone of the tectum; RVe, periventricular zone of the rhombencephalon. Scale bars are 200 μm in (a), (b), (e) and (f); 50 μm in (c) and (d); 10 μm in (g) EXPRESSION / LABELING:
|
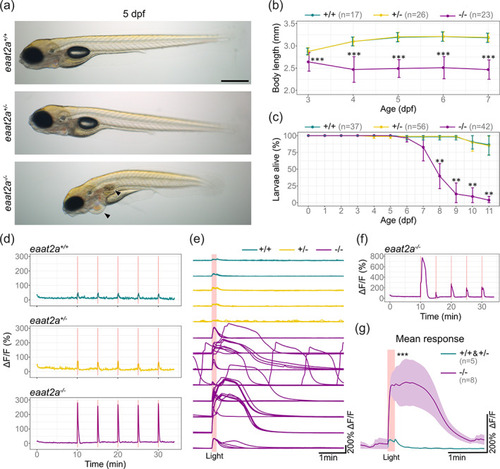
Knockout of eaat2a leads to hyperexcitability in response to light stimulation, morphological defects and larval lethality. (a) Lateral view of 5 dpf eaat2a mutants. eaat2a −/− larvae (bottom) are slightly curved, do not have an inflated swim bladder and develop pericardial edema (arrowheads). eaat2a +/+ (top) and eaat2a +/− (middle) larvae are indistinguishable. Scale bar is 500 μm. (b) Spinal cord length analysis of eaat2a mutants at consecutive days reveals a smaller body size in eaat2a −/− (magenta) compared to their eaat2a +/− (yellow) and eaat2a +/+ (cyan) siblings. Error bars show SD. (c) Mean survival of eaat2a mutants. Error bars show SD. (d) Whole‐brain neuronal activity (elavl3:GCaMP6s signal) of three representative eaat2a mutant larvae (eaat2a +/+ in cyan, eaat2a +/− in yellow and eaat2a −/− in magenta) exposed to five 10‐second light stimuli with 5‐minute interstimulus interval. (e) Changes in fluorescence over time (ΔF/F0) per larvae aligned at the onset of light stimuli (red line). (f) ΔF/F0 trace of an example eaat2a −/− larva with diverse responses to light‐stimuli. (g) Mean responses to five light stimuli per fish in 5 dpf eaat2a +/+ and eaat2a +/− (cyan, n = 5), and eaat2a −/− (magenta, n = 8) zebrafish larvae. Shaded area represents SEM. Significance level: ***p < .001, **p < .01, Dunn Kruskal Wallis multiple comparison test (b, c) or Wilcoxon rank‐sum test (g). All statistics in Supplementary Table 3 |
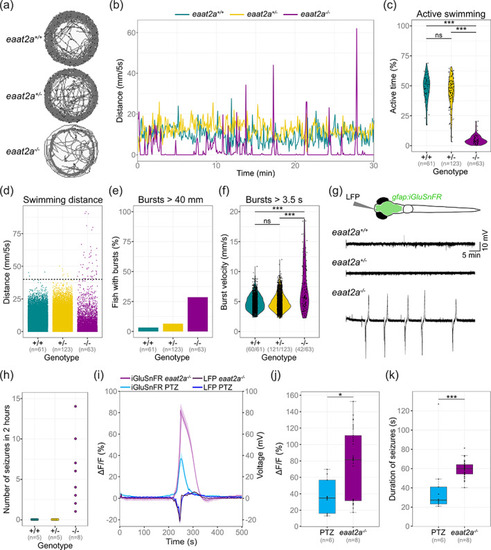
eaat2a −/− mutants show spontaneous seizures coinciding with a surge of extracellular glutamate. (a, b) Representative traces for swim location (a) and distances (b) over 30 min in 5 dpf eaat2a −/− (magenta), eaat2a +/− (yellow) and eaat2a +/+ (cyan) larvae. (c) Ratio of time period with active swimming compared between eaat2a −/− mutants (mean 4.7%) and their eaat2a +/− (mean 44.4%) and eaat2a +/+ (mean 47.6%) siblings. (d) Distance moved per five‐second integral during 30‐minute recordings, per genotype. Black dotted line represents threshold >40 mm/5 s. (e) Proportion of fish showing one or more bursts bigger than 40 mm during five‐second integrals. (f) Velocity of all bursts lasting longer than 3.5 s compared between eaat2a −/− mutants (mean 7.31 mm/s) and their eaat2a +/− (mean 4.86 mm/s) and eaat2a +/+ (mean 4.83) siblings. (g) Schematic illustration of simultaneous local field potential (LFP) recording and epifluorescent iGluSnFR imaging in a Tg(gfap:iGluSnFR) larva (top) and representative telencephalic LFP signals. (h) Number of spontaneous global seizures detected during two‐hour LFP recordings. (i) Average change in iGluSnFR fluorescence (ΔF/F0 of gfap:iGluSnFR signal) and simultaneous LFP recordings during epileptic activity in 5 dpf eaat2a −/− mutants (shades of magenta) and PTZ‐exposed wild‐types (shades of blue). Signals are aligned at the onset of seizure‐like events. (j) Mean amplitude of seizure‐like events in PTZ‐exposed (blue) and eaat2a −/− mutant (magenta) larvae. (k) Median duration of seizure‐like events in PTZ‐exposed (blue) and eaat2a −/− mutant (magenta) larvae. (i–k) nPTZ = 6 fish, 10 seizures; n eaat2a−/− = 8 fish, 40 seizures. Significance levels: ***p < .001, ns = not significant (p > .05), Dunn Kruskal‐Wallis multiple comparison test (c) or two‐sample Kolmogorov–Smirnov test (f). All statistics in Supplementary Table 3 |
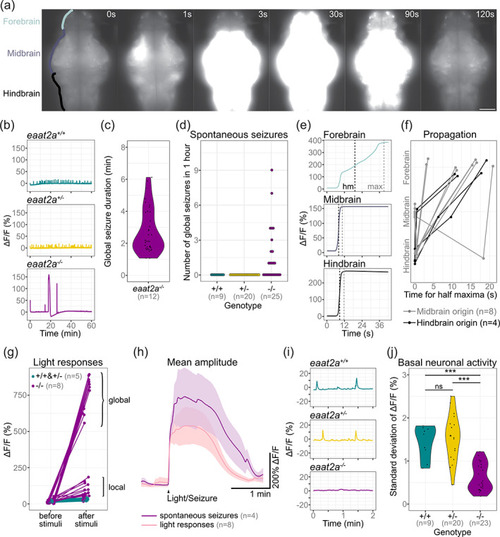
Neuronal hyperactivity during seizures contrasts with basal hypoactivity in eaat2a −/− larvae. (a) Time lapse of neuronal calcium signals during a seizure in a eaat2a −/− larva in Tg(elavl3:GCaMP5G) background (dorsal view). Scale bar is 100 μm. (b) Representative calcium signals (elavl3:GCaMP5G) recorded across the brain of eaat2a +/+ (cyan, top), eaat2a +/− (yellow, middle) and eaat2a −/− (magenta, bottom) larvae. (c) Duration of spontaneous global seizures present in 12 out of 25 eaat2a −/− mutants (median 2 min 7 s [std ± 52 sec]). n = 36 seizures. (d) Number of spontaneous global seizures per animal recorded by calcium imaging during 60 min. (e) Neuronal activity (elavl3:GCaMP5G) of the three main brain regions of a representative global seizure. The half maxima (hm) represents the time point of max(ΔF/F0)/2. (f) Relative time for ΔF/F0 half maximum represents propagation of global seizures across brain parts over time. Each line represents the mean relative time of one eaat2a −/− larva. Colors indicate region of seizure origin: light gray for midbrain, black for hindbrain. (g) Calcium signals (elavl3:GCaMP6s) 1 min before and immediately after light stimuli. Brackets indicate global (curly brackets) and local (square brackets) reflex seizures. Five light stimuli per fish. (h) Averaged calcium signals for spontaneous seizures (magenta, seven events) and light responses (light pink, 40 events) during light‐stimuli recordings. Shaded area represents SEM. (i) Magnification of (b) shows calcium signals (elavl3:GCaMP5G) during two‐minute basal activity period used for SD calculations in (j). (j) Neuronal basal activity calculated by the SD of ΔF/F0 over 2 min in eaat2a −/− mutants (mean 0.63) compared to their eaat2a +/− (mean 1.54,) and eaat2a +/+ (mean 1.44,) siblings. Significance levels: ***p < .001, ns = not significant (p > .05), Dunn Kruskal‐Wallis multiple comparison test. All statistics in Supplementary Table 3 |
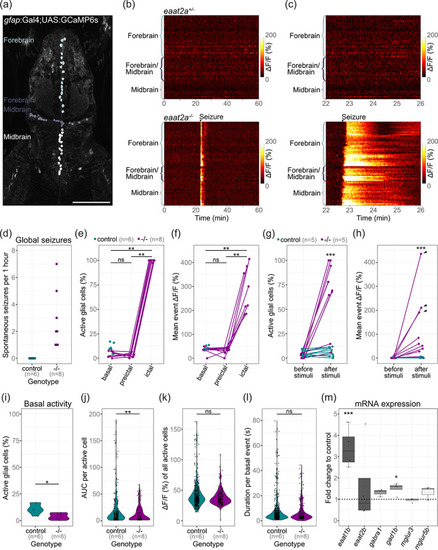
Astroglial network in eaat2a −/− mutants is silent yet hyperexcitable. (a) Two‐photon microscopy image of the forebrain and midbrain in a 5 dpf Tg(gfap:Gal4;UAS:GCaMP6s) zebrafish larva expressing GCaMP6s in GFAP positive glial cells. Individual astroglia along the ventricular regions are color‐coded according to three different areas: forebrain (light gray), forebrain/midbrain boundary region (dark gray), and midbrain (white). Scale bar is 100 μm. (b) Calcium signals (ΔF/F0) of individual glial cells over time in representative eaat2a +/− (top) and eaat2a −/− (bottom) larvae. Warm color indicates high activity as seen during the seizure in the eaat2a −/− larva. (c) Four‐minute periods of calcium signals in (b). (d) Number of global seizures detected in eaat2a −/− mutants (magenta) compared to their eaat2a +/− and eaat2a +/+ siblings (cyan). (e, f) Percentage of active glial cells (e) and average event amplitudes of active cells (f) of individual eaat2a −/− mutants during two‐minute basal/inter‐ictal, preictal and ictal (spontaneous seizures) periods. Cyan dots show average basal values of eaat2a +/+ and eaat2a +/− siblings. Figure legend in (e) also applies to (f). (g, h) Evaluation of one‐minute periods immediately before and after 10‐second light stimuli in eaat2a +/+ /eaat2a +/− (cyan) and eaat2a −/− (magenta) animals of the proportion of active cells (g) and averaged amplitude over all cells (h). Arrowheads indicate global seizures. n = 5 fish per group, 2 stimuli per fish. Figure legend in (g) also applies to (h). (i–l) Analysis during inter‐ictal basal periods of percentage active astroglia per fish (i), total activity of active cells (j, area under the curve = AUC), amplitudes (k) and durations (l) of individual calcium bursts in active glial cells are plotted in violin plots with individual data points (black). Control = eaat2a +/+ and eaat2a +/− . (m) mRNA transcript levels of eaat1b, eaat2b, gabra1, gad1b, mglur3 and mglur5b in 5 dpf eaat2a −/− relative to eaat2a +/+ siblings. Transcripts were measured by RT‐qPCR and normalized to g6pd and b2m. Data are represented in box‐and‐whisker plots with an interquartile range from first to third quartile and the median represented by the line within the boxes. Significance levels: ***p < .001, **p < .01, *p < .05, ns = not significant (p > .05), Wilcoxon signed rank test (e, f), Welch two sample unpaired t‐test (i, m) or Wilcoxon rank‐sum test (g, h, j–l). All statistics in Supplementary Table 3 |
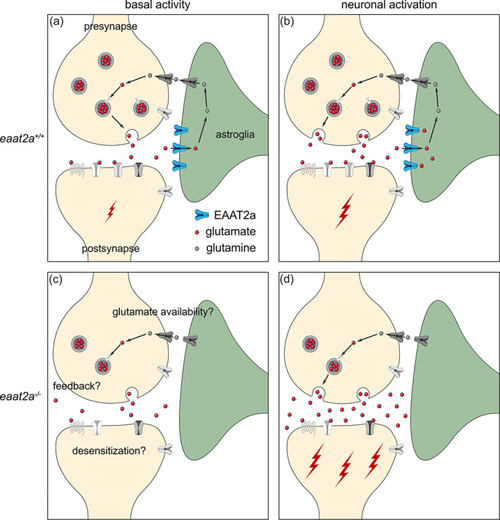
Working model of coexisting hyper‐ and hypoactivity in eaat2a −/− mutants. (a, b) Glutamate transporter EAAT2a is important for both clearance of glutamate at the synaptic cleft and recycling of glutamate to the presynapse during basal activity (a) and neuronal activation (b). (c) Loss of EAAT2a function leads to neuronal hypoactivity during basal periods, potentially reflecting reduced levels of available glutamate/glutamine. (d) Once glutamate is released in higher quantities from the presynapse (e.g., following light stimuli or spontaneous glutamate release), astroglia cannot sufficiently take up glutamate. Accumulated glutamate in the synaptic cleft hyperexcites postsynaptic neurons, which can lead to a cascade of glutamate release across the nervous system and results in epileptic seizures. Such recurrent epileptic seizures could also potentially lead to desensitization or a negative feedback to the presynapse (c), which can further explain reduced basal neuronal activity in eaat2a −/− mutants |