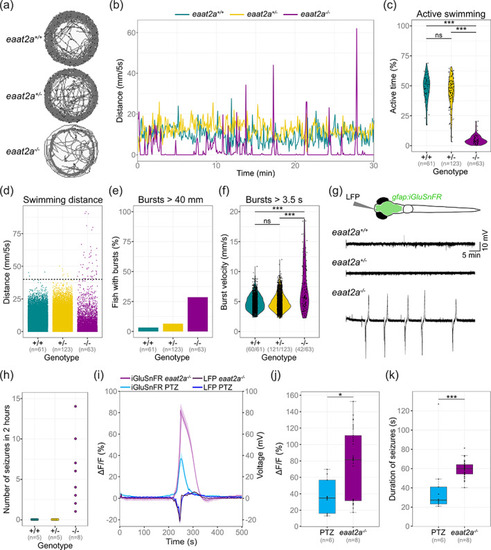
eaat2a −/− mutants show spontaneous seizures coinciding with a surge of extracellular glutamate. (a, b) Representative traces for swim location (a) and distances (b) over 30 min in 5 dpf eaat2a −/− (magenta), eaat2a +/− (yellow) and eaat2a +/+ (cyan) larvae. (c) Ratio of time period with active swimming compared between eaat2a −/− mutants (mean 4.7%) and their eaat2a +/− (mean 44.4%) and eaat2a +/+ (mean 47.6%) siblings. (d) Distance moved per five‐second integral during 30‐minute recordings, per genotype. Black dotted line represents threshold >40 mm/5 s. (e) Proportion of fish showing one or more bursts bigger than 40 mm during five‐second integrals. (f) Velocity of all bursts lasting longer than 3.5 s compared between eaat2a −/− mutants (mean 7.31 mm/s) and their eaat2a +/− (mean 4.86 mm/s) and eaat2a +/+ (mean 4.83) siblings. (g) Schematic illustration of simultaneous local field potential (LFP) recording and epifluorescent iGluSnFR imaging in a Tg(gfap:iGluSnFR) larva (top) and representative telencephalic LFP signals. (h) Number of spontaneous global seizures detected during two‐hour LFP recordings. (i) Average change in iGluSnFR fluorescence (ΔF/F0 of gfap:iGluSnFR signal) and simultaneous LFP recordings during epileptic activity in 5 dpf eaat2a −/− mutants (shades of magenta) and PTZ‐exposed wild‐types (shades of blue). Signals are aligned at the onset of seizure‐like events. (j) Mean amplitude of seizure‐like events in PTZ‐exposed (blue) and eaat2a −/− mutant (magenta) larvae. (k) Median duration of seizure‐like events in PTZ‐exposed (blue) and eaat2a −/− mutant (magenta) larvae. (i–k) nPTZ = 6 fish, 10 seizures; n eaat2a−/− = 8 fish, 40 seizures. Significance levels: ***p < .001, ns = not significant (p > .05), Dunn Kruskal‐Wallis multiple comparison test (c) or two‐sample Kolmogorov–Smirnov test (f). All statistics in Supplementary Table 3
|
