|
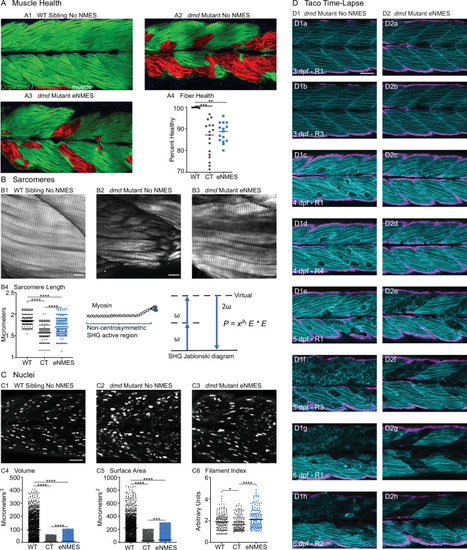
Endurance neuromuscular electrical stimulation (eNMES) improves multiple components of muscle health.(A) Machine learning was used to quantify muscle health pixel-by-pixel. Green indicates healthy pixels while red indicates unhealthy pixels. (B) Second harmonic generation (SHG) microscopy was used to quantify sarcomere length at 8 days post-fertilization (dpf). Representative SHG images of WT sibling control (B1), dmd mutant controls (B2), and dmd mutants that completed eNMES training. Anterior left, dorsal top, side mounted. Scale bars are 10 µm. (B4) Sarcomere length is significantly shorter in dmd mutant controls compared to WT sibling controls. However, eNMES significantly improves sarcomere length, bringing it closer to WT lengths. Each point represents a single sarcomere along a predetermined length of a muscle fiber. Multiple muscle fibers were measured per zebrafish. (C) Muscle nuclei were imaged at 8 dpf as a potential mechanism for improved muscle health. Anterior left, dorsal top, side mounted. (C1) Representative image of WT sibling control demonstrates healthy ellipsoidal nuclei organized along the length of the muscle fibers. (C2) Representative image of dmd mutant control demonstrates fragmented punctae as well as more spherical nuclei that clustering within the muscle segments. (C3) Representative image of dmd mutant that completed eNMES training demonstrates healthier, ellipsoidal nuclei that appear more organized within the muscle segments. Quantification of nuclear size indicates that eNMES significantly increases the volume (C4) and surface area (C5) of muscle nuclei compared to dmd mutant controls. However, nuclei are still significantly smaller compared to WT sibling controls, visually appearing to have an increased number of myonuclei compared to unstimulated dmd mutants. (C6) Filament index was used to assess circularity, specifically the departure from a circle. Filament index is significantly higher in dmd mutants that completed eNMES training, indicating that nuclei are more elongated compared to dmd mutant controls. Each point represents a single nuclei within a z-stack. (D) Transgenic dmd mutants (mylpfa:lyn-cyan [cyan], smych1:GFP [magenta]) were used to visualize changes in structural integrity of fast- and slow-twitch muscle fibers across three days. Anterior left, dorsal top, side mounted. Scale bar is 50 µm. Images were taken around the 12th myotome. (D1) Representative dmd mutant control. (D1a–D1b). At 3 dpf, there is no dystrophy in the imaged myotomes. (D1c–D1e) At 4 dpf and the beginning of 5 dpf, dystrophy is minimal with relatively few detaching muscle fibers. (D1f) However, massive muscle degeneration occurs between the first found of imaging and the third round of imaging at 5 dpf. (D1g–D1h) Fiber degeneration is still present, suggesting that the damaged muscle fibers have not been cleared and regeneration is unlikely. (D2) Representative dmd mutant that is undergoing eNMES training. (D2a–D2b) The first session of eNMES at 3 dpf does not result in immediate damage to the muscle. (D2c–D2d) Similarly, following the second session of eNMES at 4 dpf, there is no immediate muscle damage occurring in the imaged myotomes. (D2e) At 5 dpf, following the third session of eNMES, muscle fiber degeneration is evident, but by the third round of imaging (D2f), these damaged areas are being cleared and there is evidence of regeneration. (D2g–D2h) At 6 dpf, previously damaged muscle segments have new muscle fibers present. All data were analyzed using either an ordinary one-way ANOVA with Tukey’s multiple comparisons test or a Kruskal–Wallis test with Dunn’s multiple-comparison test. *p<0.05, **p<0.01, ***p<0.001, ****p<0.0001.
|