|
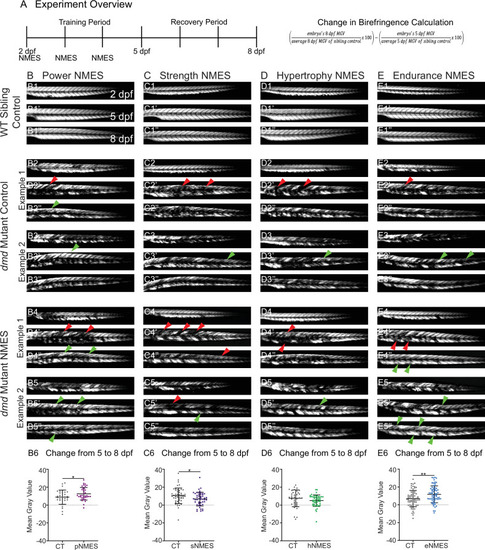
Impacts of neuromuscular electrical stimulation (NMES) paradigms on muscle structure through time.(A) Experimental overview and calculation of change in mean gray value from 5 to 8 days post-fertilization (dpf). At 2 dpf, birefringence images were taken followed by the first session of NMES. At 3 and 4 dpf, zebrafish underwent the second and third sessions of NMES, respectively. Birefringence images were taken at 5 and 8 dpf. The training program was divided into the training period (2–4 dpf) and the recovery period (5–8 dpf). (B–E) Anterior left, dorsal top, side-mounted birefringence images for WT sibling controls (panels labeled 1), control dmd mutants (two examples shown, panels labeled 2 and 3), and NMES-treated dmd mutants (two examples shown, panels labeled 4 and 5). The NMES regimens are labeled as such: panels labeled B were treated with power NMES (pNMES), panels labeled C were treated with strength NMES (sNMES), panels labeled D were treated with hypertrophy NMES (hNMES), and panels labeled E were treated with endurance NMES (eNMES). The change in mean gray values from 5 dpf to 8 dpf represents how the muscle responds to and recovers from three sessions of NMES and is shown in panels labeled 6. Positive changes indicate improvements in muscle structure while negative changes indicate deterioration in muscle structure. Red arrowheads denote degeneration from the previous time point, green arrowheads denote regeneration from the previous time point. pNMES (B6, maroon squares) and eNMES (E6, blue squares) significantly improve muscle structure in dmd mutants compared to dmd mutant controls (gray circles). sNMES (C6, purple squares) significantly worsens muscle structure in dmd mutants while hNMES (D6, green squares) trends to decrease muscle structure compared to dmd mutant controls (gray circles). Each data point represents a single zebrafish. Birefringence data were analyzed using two-sided t-tests. *p<0.05, **p<0.01.
|