|
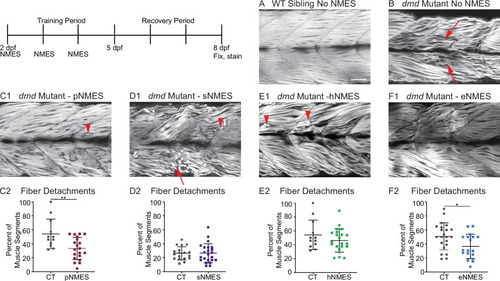
Impacts of neuromuscular electrical stimulation (NMES) paradigms on muscle fiber structure and degeneration.Phalloidin staining for F-actin at 8 days post-fertilization (dpf) allows for visualization of individual muscle fibers and the ability to count detached fibers in dmd mutants. Anterior left, dorsal top, side mounted. Red arrows point to disorganized muscle fibers, and red arrowheads point to detached muscle fibers. (A) Representative image of WT sibling demonstrates organized muscle fibers with well-defined myotome boundaries. (B) Representative image of dmd mutants demonstrates disorganized, wavy muscle fibers with poorly defined myotome boundaries and empty space between individual muscle fibers. (C1) Representative image of dmd mutant that received power NMES (pNMES) demonstrates less muscle fiber waviness, lack of empty space between muscle fibers but visible detached fibers. (D1) Representative image of dmd mutant that received strength NMES (sNMES) demonstrates massive deterioration of muscle fiber structure, disorganized myotomes with poorly defined boundaries. (E1) Representative image of dmd mutant that received hypertrophy NMES (hNMES) demonstrates improved muscle fiber organization with more defined myotome boundaries but visibly detached muscle fibers and empty space between fibers. (F1) Representative image of dmd mutant that received endurance NMES (eNMES) demonstrates healthy myotomes with clearly defined boundaries, organized muscle fibers with very few wavy fibers, and lack of empty space between fibers. Quantification of the percentage of muscle segments with detachments indicates that pNMES (C2) and eNMES (F2) significantly reduce fiber detachments in dmd mutants. sNMES (D2) and hNMES (E2) do not impact the percent of muscle segments with detachments. Each data point represents a single fish. A muscle segment is defined as half of a myotome. Muscle detachment data were analyzed using two-sided t-tests. *p<0.05, **p<0.01. Scale bar is 50 µm.
|