
Figure 4
- ID
- ZDB-FIG-220326-32
- Publication
- Ahmed et al., 2022 - Strip1 regulates retinal ganglion cell survival by suppressing Jun-mediated apoptosis to promote retinal neural circuit formation
- Other Figures
-
- Figure 1
- Figure 1—figure supplement 1
- Figure 1—figure supplement 2.
- Figure 2
- Figure 2—figure supplement 1
- Figure 2—figure supplement 2.
- Figure 3
- Figure 3—figure supplement 1—source data 1.
- Figure 3—figure supplement 2.
- Figure 4
- Figure 4—figure supplement 1.
- Figure 5
- Figure 5—figure supplement 1.
- Figure 5—figure supplement 2
- Figure 6
- Figure 6—figure supplement 1.
- Figure 6—figure supplement 2—source data 1.
- Figure 7
- Figure 8.
- All Figure Page
- Back to All Figure Page
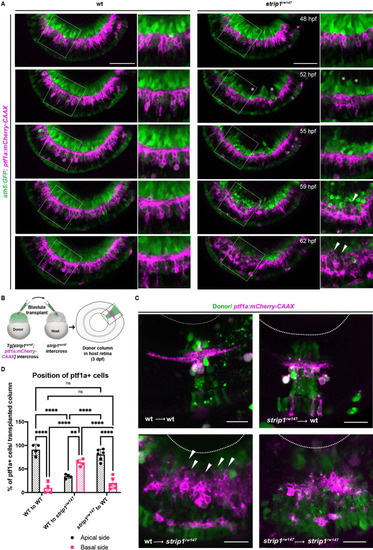
(A) Time-lapse imaging of wild-type and strip1rw147 mutant retinas combined with the transgenic line Tg[ath5:GFP; ptf1a:mCherry-CAAX] to track ACs and RGCs during IPL formation. Asterisks denote empty areas in the ganglion cell layer (GCL). Arrowheads represent infiltration of ACs into empty spaces in the GCL. Panels on the right show higher magnification of outlined areas. Scale bar, 50 μm. (B) Cell transplantation design to evaluate the cell autonomy of Strip1 in AC-mediated IPL formation. Donor embryos are from intercross of strip1rw147 heterozygous fish combined with Tg[ptf1a:mCherry-CAAX] to label ACs. Host embryos are generated by nontransgenic intercross of strip1rw147 heterozygous fish. Donor cells are labeled with dextran Alexa-488 and transplanted into host embryos to make chimeric host retinas with donor-derived retinal columns. (C) Confocal images of four combinations of transplantation outcomes: wild type to wild type, wild type to mutant, mutant to wild type, and mutant to mutant. Arrowheads indicate abnormal positioning of ACs in basal side of IPL. Scale bar, 20 μm. (D) Percentage of ACs (either at the apical or the basal side of the IPL) relative to the total number of ACs within a transplanted column. Two-way analysis of variance (ANOVA) with the Tukey multiple comparison test, n ≥ 4. Data are represented as means ± standard deviation (SD). **p < 0.01 and ****p < 0.0001.
|