Amacrine cells (ACs) are abnormally positioned at the basal side of the inner plexiform layer (IPL) in <italic toggle='yes'>strip1</italic> mutants and <italic toggle='yes'>ath5</italic> morphants.
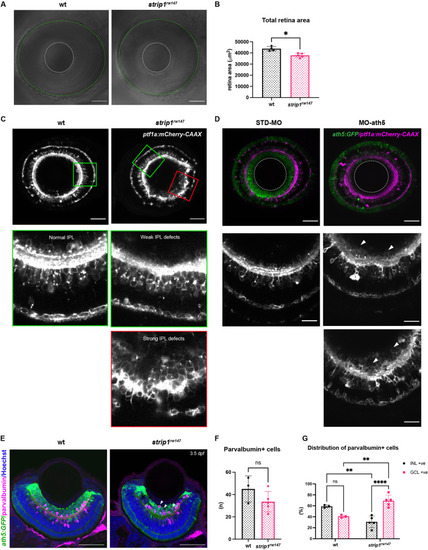
(A) Differential interference contrast images showing lateral view of wild-type and strip1rw147 mutant retinas. White dashed lines depict lens outline. Green dashed lines depict eye outline. Retina area is the area calculated between them. Scale bar, 50 μm. (B) Quantification of total retina area in wild-type and strip1rw147 mutants. Retina area is slightly but significantly reduced in mutants, compared to wild-type siblings. Mann–Whitney U-test, n ≥ 4. (C) Live confocal images of wild-type and strip1rw147 mutant retinas at 3 dpf combined with the transgenic line Tg[ptf1a:mCherry-CAAX], which labels ACs. Middle and lower panels show higher magnification of outlined areas. Abnormal positioning of ACs in the ganglion cell layer (GCL) is more prominent in areas of strong IPL defects than in areas of weak lamination defects. Scale bar, 50 μm. (D) Live confocal images of retinas of STD-MO and MO-ath5-injected wild-type embryos combined with the transgenic line Tg[ath5:GFP; ptf1a:mCherry-CAAX], which labels RGCs and ACs. Middle and bottom panels show higher magnification images to show abnormal localization of ACs in GCL (arrowheads) and disrupted IPL. Scale bars, 50 μm (upper panels) and 20 μm (middle and lower panels). (E) Wild-type and strip1rw147 mutant retinas at 3.5 dpf labeled with anti-parvalbumin which labels subsets of ACs. Arrows indicate abnormal positioning of ACs in the GCL. Nuclei are stained with Hoechst. Scale bar, 50 μm. (F) The number of parvalbumin+ cells per retina. Student’s t test with Welch’s correction, n ≥ 3. (G) Percentage of parvalbumin+ cells (GCL+ or INL+) to the total number of parvalbumin+ cells. Two-way analysis of variance (ANOVA) with the Tukey multiple comparison test, n ≥ 3. For all graphs, data are represented as means ± standard deviation (SD). ns, not significant, *p < 0.05, **p < 0.01, and ****p < 0.0001.
Data for <xref rid='fig2s1' ref-type='fig'>Figure 2—figure supplement 1B,F,G</xref>.
Expression Data
Expression Detail
Antibody Labeling
Phenotype Data
Phenotype Detail
Acknowledgments
This image is the copyrighted work of the attributed author or publisher, and
ZFIN has permission only to display this image to its users.
Additional permissions should be obtained from the applicable author or publisher of the image.
Full text @ Elife
Your Input Welcome
Thank you for submitting comments. Your input has been emailed to ZFIN curators who may contact you if
additional information is required.
Oops. Something went wrong. Please try again later.