
FIGURE
Figure 4
- ID
- ZDB-FIG-220309-23
- Publication
- Scaia et al., 2022 - Sex Differences in Aggression Are Paralleled by Differential Activation of the Brain Social Decision-Making Network in Zebrafish
- Other Figures
- All Figure Page
- Back to All Figure Page
Figure 4
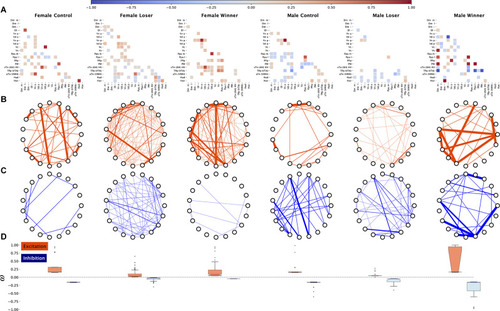
Functional connectivity across the brain regions induced by aggressive interactions, inferred from pS6 immunoreactive cells used as a marker of neural activity. |
Expression Data
Expression Detail
Antibody Labeling
Phenotype Data
Phenotype Detail
Acknowledgments
This image is the copyrighted work of the attributed author or publisher, and
ZFIN has permission only to display this image to its users.
Additional permissions should be obtained from the applicable author or publisher of the image.
Full text @ Front. Behav. Neurosci.