FIGURE

Figure 3

ID
ZDB-FIG-220309-22
Publication
Scaia et al., 2022 - Sex Differences in Aggression Are Paralleled by Differential Activation of the Brain Social Decision-Making Network in Zebrafish
Other Figures
All Figure Page
Back to All Figure Page
Figure 3

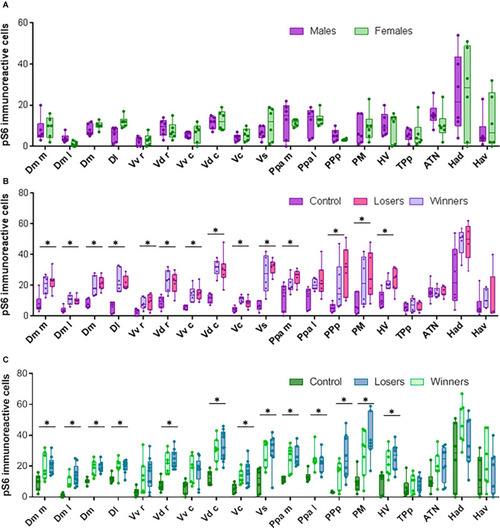
Neural activation in brain areas from the Social decision Making Network after aggressive encounters. (A) pS6 immunoreactive cells in brains from control animals that were not exposed to social interactions. (B) pS6 immunoreactive cells in males. (C) pS6 immunoreactive cells in females. Box plots were used to plot the data: the box extends to the furthest data points within the 25th and 75th percentile, and whiskers extend to the furthest data points not considered outliers. Asterisks indicate significant differences (p < 0.05) between controls and fish exposed to social interactions using the Kruskal-Wallis test.

Expression Data

Expression Detail
Antibody Labeling
Phenotype Data

Phenotype Detail
Acknowledgments
This image is the copyrighted work of the attributed author or publisher, and ZFIN has permission only to display this image to its users. Additional permissions should be obtained from the applicable author or publisher of the image. Full text @ Front. Behav. Neurosci.