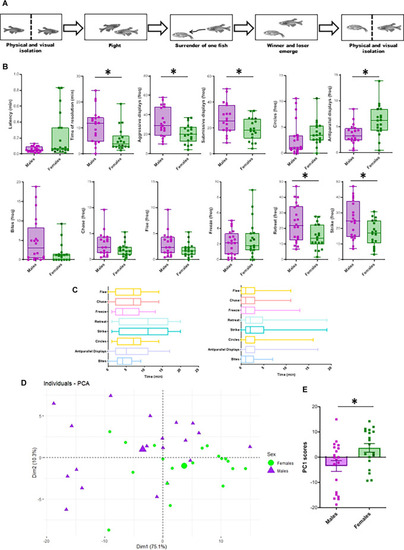
Sex differences in aggressive behavior. (A) Schematic illustration of experimental protocol for zebrafish fighting. After overnight physical and visual isolation, sex-matched dyads perform agonistic behaviors until one of the fish surrenders. After winner and loser determination, both opponents were isolated again until tissue collection. (B) Sex differences in behavioral parameters. Latency and time of resolution are expressed in minutes. The frequency of each agonistic behavior is calculated as the number of each behavioral display, divided by the duration of the encounter until conflict resolution. Aggressive behaviors include antiparallel displays, circles, bites, chases and strikes, while submissive behaviors include freeze, flee, and retreats (Oliveira et al., 2011). Box plots were used to plot the data: the box extends to the furthest data points within the 25th and 75th percentile, and whiskers extend to the furthest data points not considered outliers. Asterisks indicate significant differences (p < 0.05) using t-test (frequency of aggressive and submissive behaviors, antiparallel displays, chases, flee, strikes, retreats) or Mann-Whitney (latency, time of resolution, frequency of bites, circles, freeze). (C) Temporal dynamics of male-male (left) and female-female (right) encounters. All behaviors were analyzed and quantified during each dyadic encounter, and graphs indicate the presence of each behavior throughout all encounters. Error bars represent the earliest and latest moment in which each behavior is observed. The line inside the boxes represenst the median. (D) PCA-based on all behavioral traits (bites, circles, chase, antiparallel displays, flee, strike, retreat, and freeze) in males and females. Purple triangles indicate male individual scores and green dots indicate female individual scores for PC1 and PC2, whereas the larger purple triangle indicates the centroid of the male distribution and the larger green dot the centroid of the female data points Differences between the sexes were assessed using Euclidean dissimilarities and each test was conducted using 999 permutations of appropriate units (perMANOVA p-value = 0.012, F = 5.5502). (E) Box plots comparing male and female PC1 scores (Mann-Whitney U test: W = 463.5, p = 0.0190).

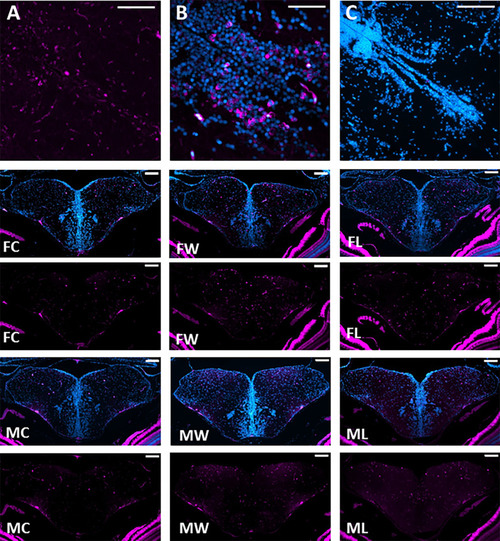
Neuronal activation throughout the brain Social Decision Making Network. (A) pS6 immunopositive staining with cytoplasmatic location is indicated in magenta. (B) Sections were co-stained with DAPI, indicated in cyan. (C) Negative control for pS6 and DAPI immunofluorescence. Representative photomicrographs of double DAPI (blue) and pS6 (magenta) and only pS6 staining (magenta) in Dm, Dl, Vc, Vd, and Vv of female controls (FC), female winners (FW), female losers (FL), male controls (MC), male winners (MW), and male losers (ML). Scale bars represent 100 mm.

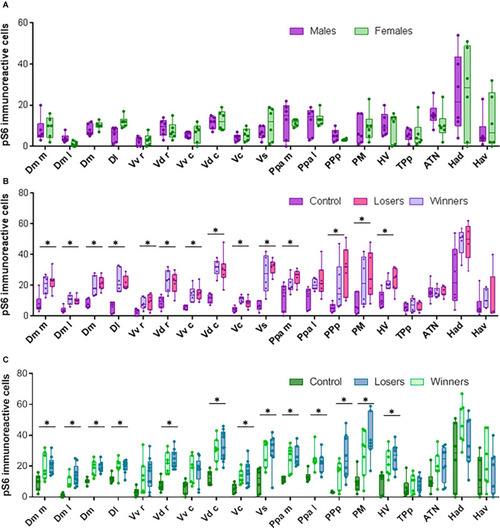
Neural activation in brain areas from the Social decision Making Network after aggressive encounters. (A) pS6 immunoreactive cells in brains from control animals that were not exposed to social interactions. (B) pS6 immunoreactive cells in males. (C) pS6 immunoreactive cells in females. Box plots were used to plot the data: the box extends to the furthest data points within the 25th and 75th percentile, and whiskers extend to the furthest data points not considered outliers. Asterisks indicate significant differences (p < 0.05) between controls and fish exposed to social interactions using the Kruskal-Wallis test.

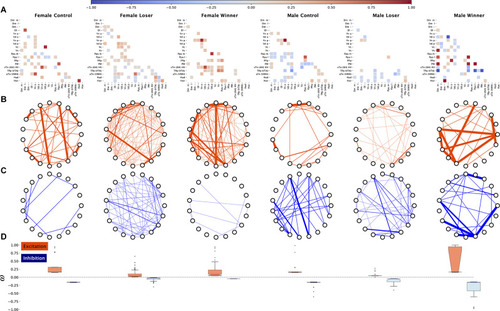
Functional connectivity across the brain regions induced by aggressive interactions, inferred from pS6 immunoreactive cells used as a marker of neural activity. (A) Adjacency matrices for each treatment showing the strongest negative and positive edges, sparsified for visualization puroposes, (B) excitation (positive weights) subnetworks for each treatment, (C) inhibition (negative weights) subnetworks for each treatment, (D) distributions of edge weights for excitation and inhibition subnetworks for each treatment.

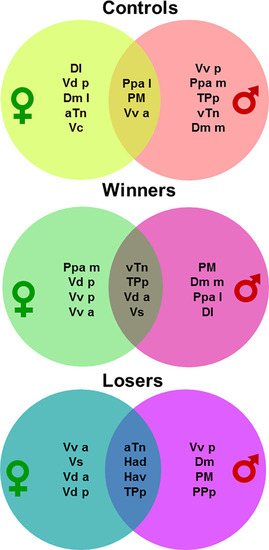
Venn diagrams representing the most central nodes of the brain social decision-making network in males and females for each social treatment (i.e., non-interacting control, winners, losers). For brain region abbreviations please see the “Materials and Methods” section.

Acknowledgments
This image is the copyrighted work of the attributed author or publisher, and ZFIN has permission only to display this image to its users. Additional permissions should be obtained from the applicable author or publisher of the image. Full text @ Front. Behav. Neurosci.