
Image
|
Figure Caption
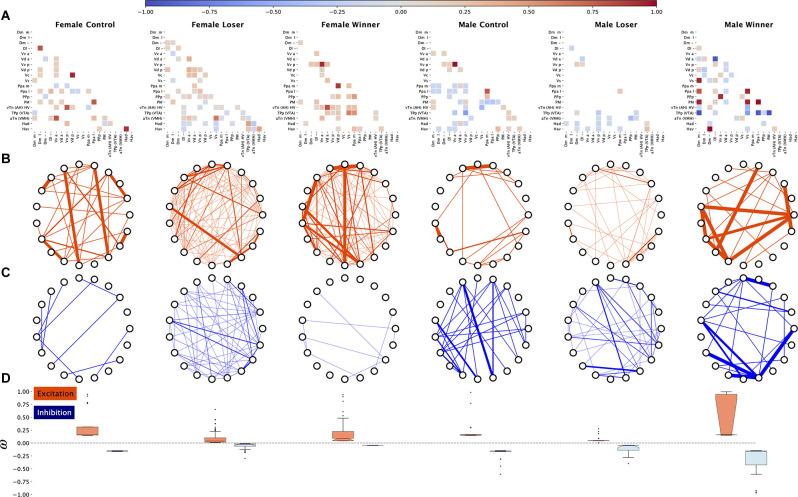
Figure 4
Functional connectivity across the brain regions induced by aggressive interactions, inferred from pS6 immunoreactive cells used as a marker of neural activity.
Acknowledgments
This image is the copyrighted work of the attributed author or publisher, and
ZFIN has permission only to display this image to its users.
Additional permissions should be obtained from the applicable author or publisher of the image.
Full text @ Front. Behav. Neurosci.