
Figure 2
- ID
- ZDB-FIG-220302-181
- Publication
- Lübke et al., 2022 - mdka Expression Is Associated with Quiescent Neural Stem Cells during Constitutive and Reactive Neurogenesis in the Adult Zebrafish Telencephalon
- Other Figures
- All Figure Page
- Back to All Figure Page
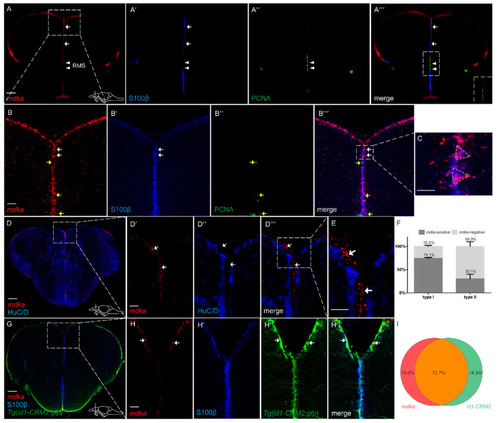
mdka is mainly expressed in non-proliferating RGCs in the telencephalon (A–A‴,B–B‴). Fluorescent in situ hybridization (FISH) with a probe directed against mdka mRNA (red) combined with Immunofluorescence (IF) with antibodies against PCNA (green) and S100β (blue) on cross-sections of WT telencephala. mRNA expression is detected in S100β+ cells and not detected in cells which are positive for PCNA. White arrows indicate mdka+/S100β+ cells. Yellow arrows indicate mdka−/PCNA+ cells. White arrowheads point to RMS. (A‴) inset: magnified view of the RMS, showing no co-expression between mdka mRNA and PCNA. Boxed-in area in (A) represents area of magnification in (B–B‴). Boxed-in area in (B‴) represents area of magnification in (C), showing two radial glial cells with their characteristic triangular shape and high expression of mdka. (D–E) FISH against mdka mRNA (red) with IF against the neuronal marker HuC/D (blue) indicating that mdka is not expressed in mature neurons since there is no co-localization between the two signals. Boxed-in area in (D) represents area of magnification in (D′–D‴). Boxed-in area in (D‴) represents area of magnification in (E). White arrowheads indicate mdka+/HuC/D− cells. (F) Quantification of S100β+, PCNA− type I and S100β+, PCNA+ type II cells expressing mdka mRNA. (G–H‴) FISH against mdka mRNA (red) combined with IF with antibodies against S100β (blue) on brains of the Tg(id1-CRM2:gfp) transgenic line (GFP, green). Expression of mdka mRNA is highly co-localized with cells positive for the transgene (green). White arrows show mdka+/id1-CRM2+ cells. Boxed-in area in (G) represents area of magnification in (H–H‴). (I) Quantification of cells expressing mdka mRNA in the Tg(id1-CRM2:gfp) transgenic line. Scale bar = 100 µm (A–A‴,D,G), 20 µm (B–C,D′–E,H–H‴). Location of cross-sections is indicated in lower right-hand corner of (A,D,G), respectively. n = 9 sections for quantifications. Abbreviations: id1, inhibitor of DNA binding 1; RMS, rostral migratory stream. |
| Genes: | |
|---|---|
| Fish: | |
| Anatomical Term: | |
| Stage: | Adult |