
Figure 5
- ID
- ZDB-FIG-220131-672
- Publication
- Zhang et al., 2021 - The landscape of regulatory genes in brain-wide neuronal phenotypes of a vertebrate brain
- Other Figures
- All Figure Page
- Back to All Figure Page
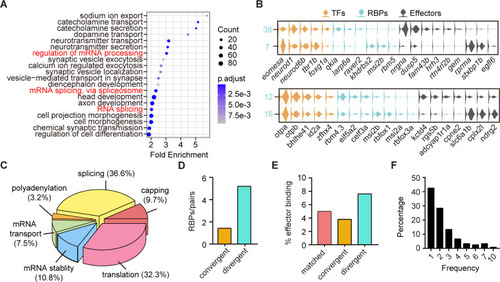
(A) Dot plot showing Gene Ontology (GO) analysis of differentially expressed genes between each pair clusters with divergent pattern. Red highlighted the category of post-transcriptional regulators. The number of genes in each category was coded by dot size, p.adjust of each category was color-coded. (B) Violin plots showing the expression of genes encoding TFs (yellow), RNA-binding proteins (RBPs) (blue), and effector genes (black) in two pairs of neuronal clusters with divergent pattern (7/38 were glutamatergic neurons, 12/16 were GABAergic neurons). (C) 3D pie plot showing the functional annotation of differentially expressed RBP genes identified in A. (D) Bar plot showing the number of pattern-specific RBPs per pair in different patterns. Each pattern was color-coded. (E) Bar plot showing the effector binding target proportion of pattern-specific RBPs. Each pattern was color-coded. (F) Bar plot showing the percentage of one RBP used as differentially expressed genes between pair clusters with different patterns.
|