
Figure 1
- ID
- ZDB-FIG-220131-660
- Publication
- Zhang et al., 2021 - The landscape of regulatory genes in brain-wide neuronal phenotypes of a vertebrate brain
- Other Figures
- All Figure Page
- Back to All Figure Page
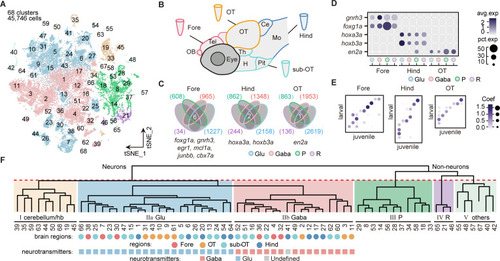
(A) The t-distributed stochastic neighbor embedding (t-SNE) plot of 45,746 single-cell transcriptomes pooled from whole brains (n = 4) and four different individual brain regions (n = 2 each). The pooled cells were aggregated into 68 clusters, marked by a number. Each color-coded the major cell type as F. (B) The schematic showing different samples separately examined by single-cell RNA-sequencing on 10× Genomics Drop-seq platform: whole brain (n = 4), forebrain (Fore, n = 2), optic tectum (OT, n = 2), hindbrain (Hind, n = 2), and the region underneath the optic tectum (sub-OT, n = 2). OB: olfactory bulb; Tel: telencephalon; OT: optic tectum; Th: thalamus; H: hypothalamus; Pit: pituitary; Ce: cerebellum; MO: medulla oblongata. (C) Venn plots showing the differentially expressed genes in four major cell types identified by cell-type marker genes (vglut+, glutamatergic neurons, Glu; gad1b+, GABAergic neurons, Gaba; pcna+, neuroprogenitors, P; cx43+, radial astrocytes, R) in three brain regions (Fore, Hind, and OT). Commonly expressed genes in all cell types for a given brain region were identified as region-specific genes: six for forebrain (Fore), one for optic tectum (OT), and one for hindbrain (Hind), with genes listed below. (D) Dot plot showing the expression levels of region-specific marker genes in four major cell types (colored circles as C) in three brain regions. The gray level represents the average expression; dot size represents the percentage of cells expressing the marker genes. (E) Lawson-Hanson algorithm for non-negative least squares (NNLS) analysis showed cell clusters of Fore, OT, and Hind exhibited a high correlation with their counterparts of the juvenile zebrafish. Degree of correlation in marker genes is coded by the gray level and size of circle. (F) The dendrogram for the taxonomy of 68 identified clusters based on effector gene profiles (n = 1099). Main branches of neuronal and non-neuronal cells were classified into six branches (red dashed line) that include: I, cerebellum and habenula (hb); IIa, glutamatergic neurons (Glu); IIb, inhibitory neurons (Gaba); III, neuroprogenitors (P); IV, radial astrocytes (R); V, others, including microglia, endothelial cells, and oligodendrocytes. The colored dots and squares below indicate their regional origins and neurotransmitter-type, respectively.
|