
- Title
-
The landscape of regulatory genes in brain-wide neuronal phenotypes of a vertebrate brain
- Authors
- Zhang, H., Wang Haifang, H., Shen, X., Jia, X., Yu, S., Qiu, X., Wang, Y., Du, J., Yan, J., He, J.
- Source
- Full text @ Elife
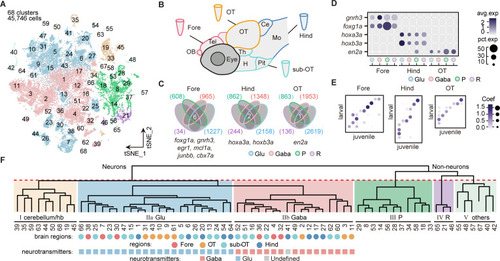
(A) The t-distributed stochastic neighbor embedding (t-SNE) plot of 45,746 single-cell transcriptomes pooled from whole brains (n = 4) and four different individual brain regions (n = 2 each). The pooled cells were aggregated into 68 clusters, marked by a number. Each color-coded the major cell type as F. (B) The schematic showing different samples separately examined by single-cell RNA-sequencing on 10× Genomics Drop-seq platform: whole brain (n = 4), forebrain (Fore, n = 2), optic tectum (OT, n = 2), hindbrain (Hind, n = 2), and the region underneath the optic tectum (sub-OT, n = 2). OB: olfactory bulb; Tel: telencephalon; OT: optic tectum; Th: thalamus; H: hypothalamus; Pit: pituitary; Ce: cerebellum; MO: medulla oblongata. (C) Venn plots showing the differentially expressed genes in four major cell types identified by cell-type marker genes (vglut+, glutamatergic neurons, Glu; gad1b+, GABAergic neurons, Gaba; pcna+, neuroprogenitors, P; cx43+, radial astrocytes, R) in three brain regions (Fore, Hind, and OT). Commonly expressed genes in all cell types for a given brain region were identified as region-specific genes: six for forebrain (Fore), one for optic tectum (OT), and one for hindbrain (Hind), with genes listed below. (D) Dot plot showing the expression levels of region-specific marker genes in four major cell types (colored circles as C) in three brain regions. The gray level represents the average expression; dot size represents the percentage of cells expressing the marker genes. (E) Lawson-Hanson algorithm for non-negative least squares (NNLS) analysis showed cell clusters of Fore, OT, and Hind exhibited a high correlation with their counterparts of the juvenile zebrafish. Degree of correlation in marker genes is coded by the gray level and size of circle. (F) The dendrogram for the taxonomy of 68 identified clusters based on effector gene profiles (n = 1099). Main branches of neuronal and non-neuronal cells were classified into six branches (red dashed line) that include: I, cerebellum and habenula (hb); IIa, glutamatergic neurons (Glu); IIb, inhibitory neurons (Gaba); III, neuroprogenitors (P); IV, radial astrocytes (R); V, others, including microglia, endothelial cells, and oligodendrocytes. The colored dots and squares below indicate their regional origins and neurotransmitter-type, respectively.
|

(A) The schematic showing the procedure of collecting single-cell transcriptomes of neuromodulator neurons with fluorescence-activated cell sorting (FACS). Using Tg (ETvmat2:GFP) fishline, we could isolate dopaminergic (DA), serotonergic (5-HT), and norepinephrinergic (NE) neurons. (B) The t-distributed stochastic neighbor embedding (t-SNE) plot of 5368 cells obtained from Tg (ETvmat2:GFP) fishline expressing monoaminergic neuromodulators, showing 22 clusters, each marked by a number, color-coding brain regions and cell type of each cluster. (C) Dot plot showing the expression of glutamatergic marker (vglut2a/vglut2b/vglu1/vglu3) and GABAergic marker (gad1b/gad2) in each of the 22 vmat2+ clusters in B. The neurotransmitter phenotypes were color-coded. Empty squares depict the ones with undefined neurotransmitter phenotypes. The average expression levels of these genes for all cells in each cluster were coded by the gray level. The percentage of cells expressing each gene within each cluster was coded by dot size.
|
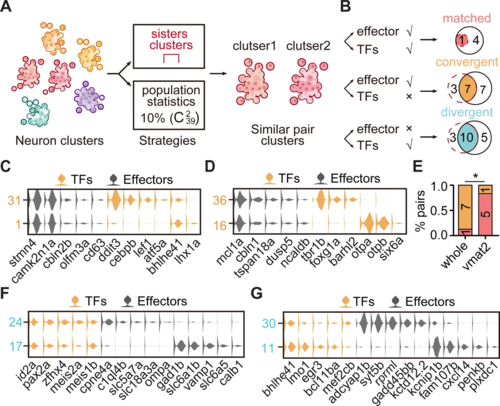
(A) Schematic showing the strategies to assess the cluster similarity based on effector gene and TF profiles. We focused on clusters of whole-brain glutamatergic/GABAergic neurons and neuromodulator neurons. Similar pair clusters were identified by two strategies: the first strategy was based on hierarchical sister clusters. The second strategy was based on population-level statistical analysis, in which we calculated and ranked the distances of every two clusters from 39 neurotransmitter-type clusters () and chose the ones with the lowest 10% distance as similar pair clusters. (B) Left: schematic showing the criteria of three patterns: pair clusters that were similar in both TF and effector gene profiles as ‘matched pattern’, those pair clusters that were similar in effector gene profiles but not in TF profiles as ‘convergent pattern’, and those pair clusters that were similar in TF profiles but not in effector gene profiles as ‘divergent pattern’. Right: the plot showing the number of each pattern using two strategies in A. The red dashed circle showing the number of cluster pairs with given pattern based on hierarchical sister cluster analysis; the black solid circle showing the number of cluster pairs with given pattern based on population-level statistical analysis. (C–D) Violin plots showing the expression of TFs (yellow) or effector genes (black) in glutamatergic and GABAergic similar pair clusters of convergent pattern. (E) The bar plot showing the proportions of different patterns for neuronal clusters with neurotransmitter or neuromodulator types. The numbers of each pattern were indicated. Fisher′s exact test was used to test the significant association of different patterns, p = 0.02564, *p < 0.05. (F–G) Violin plots showing the expression of TF profiles (yellow) or effector gene profiles (black) in neuronal clusters of divergent pattern.
|

(A) Left: the schematic showing the procedure of collecting single-cell transcriptomes of tectal glutamatergic neurons with fluorescence-activated cell sorting (FACS) using Tg (vglut2a:loxp-DsRed-loxp-GFP) fishline. Right: the t-distributed stochastic neighbor embedding (t-SNE) plot of 3, 883 cells obtained from Tg (vglut2a:loxp-DsRed-loxp-GFP) fishline labelling glutamatergic neurons in the optic tectum showing 11 clusters, each color-coded and marked by a number. (B) Schematic showing the designing of the Gal4FF BAC plasmids for six TF marker genes, covering all 11 clusters of tectal glutamatergic neurons shown in A. (C) Schematic showing the method for single TF-based labeling of tectal glutamatergic neurons. CRE expressed in glutamatergic neurons was used to excise loxp and drive fluorescent tdTomatocaax expression. (D) Representative images of seven subclasses of tectal glutamatergic neurons with distinct morphological subclasses using the method described in (B–C). The number of neurons collected for each subclass was shown. Insets depicted the morphological characteristics. Neurons with ascending and descending projections were those projecting to the forebrain and hindbrain, respectively. Solid lines marked the boundaries between brain regions. Dashed lines marked the boundary of the tectal neuropile. Scale bars: 20 μm. (E) The matrix showing the expressions of six TFs in each of seven morphological subclasses. The black squares represented TFs could label particular morphological subclasses, and no expression was indicated by white squares.
|
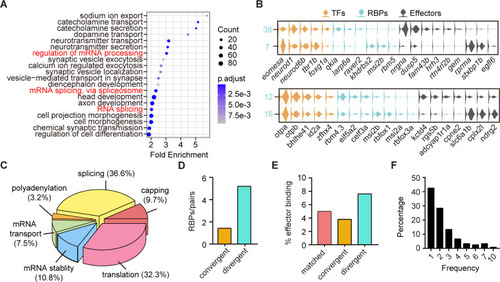
(A) Dot plot showing Gene Ontology (GO) analysis of differentially expressed genes between each pair clusters with divergent pattern. Red highlighted the category of post-transcriptional regulators. The number of genes in each category was coded by dot size, p.adjust of each category was color-coded. (B) Violin plots showing the expression of genes encoding TFs (yellow), RNA-binding proteins (RBPs) (blue), and effector genes (black) in two pairs of neuronal clusters with divergent pattern (7/38 were glutamatergic neurons, 12/16 were GABAergic neurons). (C) 3D pie plot showing the functional annotation of differentially expressed RBP genes identified in A. (D) Bar plot showing the number of pattern-specific RBPs per pair in different patterns. Each pattern was color-coded. (E) Bar plot showing the effector binding target proportion of pattern-specific RBPs. Each pattern was color-coded. (F) Bar plot showing the percentage of one RBP used as differentially expressed genes between pair clusters with different patterns.
|
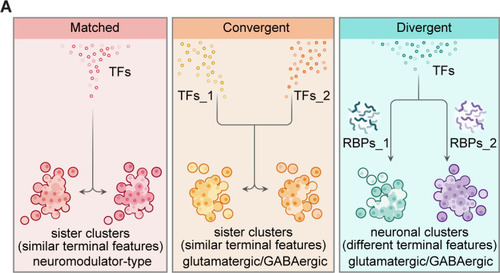
(A) Graphic summary describes the general organization of transcription factors (TFs) and post-transcriptional regulators in the specification of neuronal clusters at the whole-brain level. Effector genes describe the terminal features of whole-brain neuronal classification. Neuronal clusters with similar terminal features (named ‘sister clusters’) can share TF profiles (‘matched’, left), or exhibit distinct TF profiles (‘convergent’, middle). Besides, neuronal clusters with distinct effector gene profiles (terminal features) can share TFs profiles (‘divergent’, right), and in each pairs, two neuronal clusters are differentially marked by the expression of RNA-binding proteins (RBPs) at the post-transcriptional levels. Moreover, sister clusters with ‘convergent’ and ‘divergent’ patterns are glutamatergic/GABAergic neurons, whereas sister clusters with ‘matched’ pattern are neuromodulator-type neurons.
|