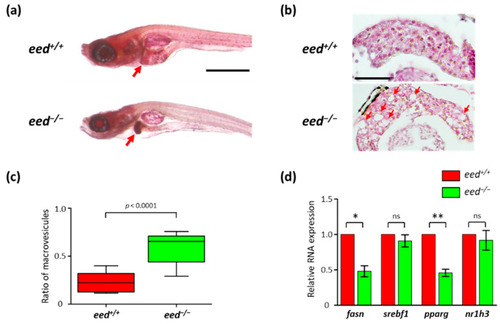
Liver alterations in eed-deficient larvae: (a) representative images of lateral views of eed+/+ and eed−/− larvae stained with oil red-O at 11 dpf. The red arrow shows the liver. Scale bar is 500 µm; (b) histological sections stained with hematoxylin and eosin showing the liver of eed+/+ and eed−/− larvae at 11 dpf. Red arrows show macrovesicles. Scale bar is 50 µm; (c) quantification of macrovesicular steatosis eed+/+ (red) and eed−/− (green) larvae at 11 dpf. The ratio of macrovesicular structures relative to total hepatic surface was calculated on 3 histological slices per larvae from 4 different larvae per genotype. Statistical significance was assessed using a Mann–Whitney t-test; (d) relative levels of fasn, srebf1, pparg, and nr1h3 RNA abundances in 9 dpf old eed+/+ (red) and eed−/− (green) larvae quantified by RT-qPCR. Three independent experiments were performed, and error bars represent standard deviation. Statistical analysis was performed using a one-way ANOVA test followed by a Dunn’s multiple test comparison; ns, non-significant; *, p < 0.05; **, p < 0.01.
|
