
Figure 1
- ID
- ZDB-FIG-211025-48
- Publication
- Paolini et al., 2021 - Mechanosensitive Notch-Dll4 and Klf2-Wnt9 signaling pathways intersect in guiding valvulogenesis in zebrafish
- Other Figures
- All Figure Page
- Back to All Figure Page
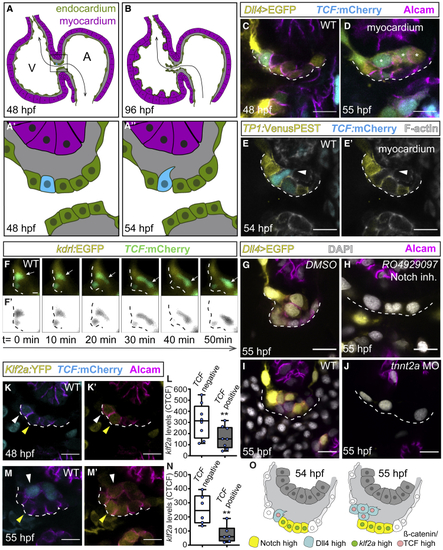
Dll4 and TCF reporters are co-expressed in ingressing endocardial cells (A–B) Model depicting the zebrafish embryonic heart. (A and A′) At 48 hpf, the superior AVC endocardium (black square in A) is monolayered and blood flow is bi-directional (black arrow) (A′). (A″) At 54 hpf, single cells ingress into the cardiac jelly. (B) At 96 hpf, valve leaflets have formed, and blood flow is uni-directional (black arrow). (C–E) Single confocal z section plane images of the superior AVC endocardium. (C and D) Single cells express (F) Light-sheet microscopy time-lapse images of a TCF-positive ingressing endocardial cell (white arrows) at the superior AVC. (F′) Black and white rendering highlights the ingressing cell. (G–J) Single confocal z section plane images of the superior AVC endocardium at 55 hpf. (G and H) Upon Notch inhibition, the superior AVC endocardium remains monolayered and has a decreased expression of the Dll4 reporter. (I and J) (K–N) Quantification of (O) Model depicting the superior AVC endocardium at stages when singled-out cells ingress into the cardiac jelly. Scale bars, 5 μm. |
| Genes: | |
|---|---|
| Antibody: | |
| Fish: | |
| Condition: | |
| Knockdown Reagent: | |
| Anatomical Terms: | |
| Stage: | Long-pec |
| Fish: | |
|---|---|
| Condition: | |
| Knockdown Reagent: | |
| Observed In: | |
| Stage: | Long-pec |