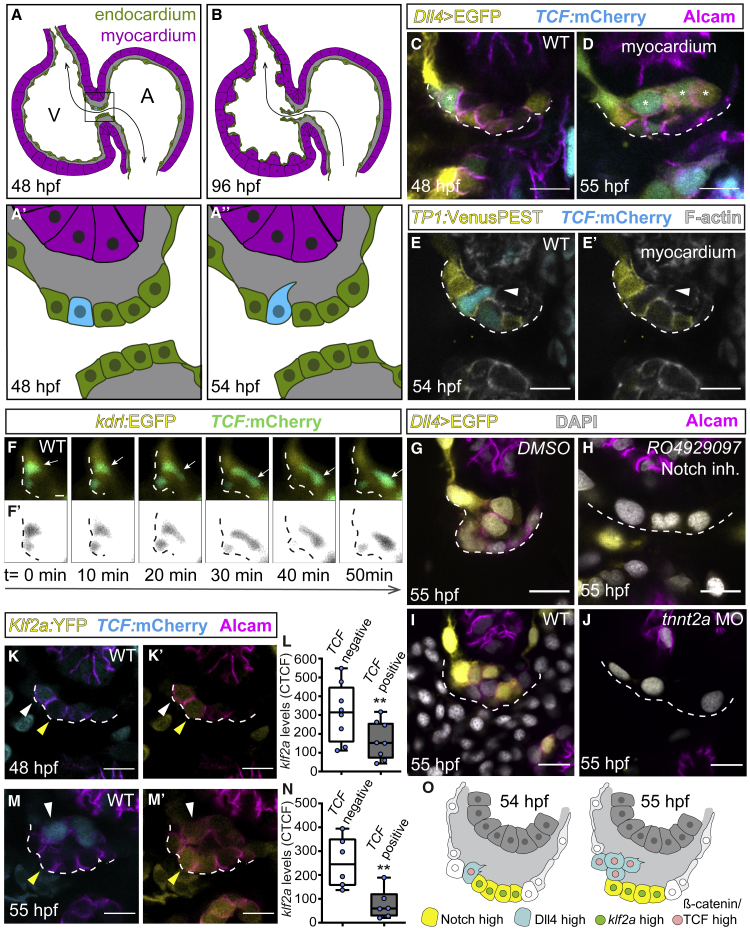
IMAGE

Figure 1

ID
ZDB-IMAGE-211025-63
Genes
Antibodies
Source
Figures for Paolini et al., 2021
Image
Figure Caption

Figure 1

Dll4 and TCF reporters are co-expressed in ingressing endocardial cells

(A–B) Model depicting the zebrafish embryonic heart.

(A and A′) At 48 hpf, the superior AVC endocardium (black square in A) is monolayered and blood flow is bi-directional (black arrow) (A′).

(A″) At 54 hpf, single cells ingress into the cardiac jelly.

(B) At 96 hpf, valve leaflets have formed, and blood flow is uni-directional (black arrow).

(C–E) Single confocal z section plane images of the superior AVC endocardium. (C and D) Single cells express Dll4 and TCF reporter at 48 and 55 hpf (asterisks). (E and E′) Similarly, only single cells express the TCF reporter at 54 hpf (white arrowhead). Those cells are always negative for Notch activity reporter expression.

(F) Light-sheet microscopy time-lapse images of a TCF-positive ingressing endocardial cell (white arrows) at the superior AVC. (F′) Black and white rendering highlights the ingressing cell.

(G–J) Single confocal z section plane images of the superior AVC endocardium at 55 hpf. (G and H) Upon Notch inhibition, the superior AVC endocardium remains monolayered and has a decreased expression of the Dll4 reporter. (I and J) Dll4 expression and singling out of AVC endocardial cells is prevented in absence of blood flow (tnnt2a MO).

(K–N) Quantification of klf2a:YFP levels in luminal versus TCF-positive cells at 48 hpf (K–L) and 55 hpf (M–N). The corrected total cell fluorescence (CTCF) of TCF-positive ingressing cells (white arrowheads) is compared with the CTCF of neighboring TCF-negative cells (yellow arrowheads) (48 hpf, n = 16 embryos; 55 hpf, n = 12 embryos). Single values are shown in a boxplot. Lines inside the box represent mean values. The lower and upper whiskers indicate minimum and maximum values, respectively (∗∗p < 0.01 by paired Student’s t test).

(O) Model depicting the superior AVC endocardium at stages when singled-out cells ingress into the cardiac jelly. Scale bars, 5 μm.

Figure Data
Acknowledgments
This image is the copyrighted work of the attributed author or publisher, and ZFIN has permission only to display this image to its users. Additional permissions should be obtained from the applicable author or publisher of the image. Full text @ Cell Rep.