FIGURE SUMMARY
Title

Mechanosensitive Notch-Dll4 and Klf2-Wnt9 signaling pathways intersect in guiding valvulogenesis in zebrafish

Authors
Paolini, A., Fontana, F., Pham, V.C., Rödel, C.J., Abdelilah-Seyfried, S.
Source
Full text @ Cell Rep.

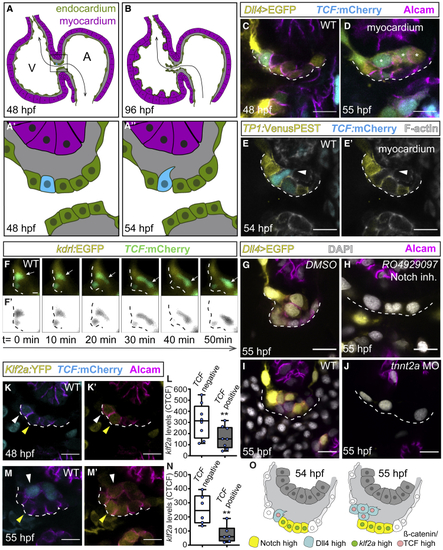
Dll4 and TCF reporters are co-expressed in ingressing endocardial cells

(A–B) Model depicting the zebrafish embryonic heart.

(A and A′) At 48 hpf, the superior AVC endocardium (black square in A) is monolayered and blood flow is bi-directional (black arrow) (A′).

(A″) At 54 hpf, single cells ingress into the cardiac jelly.

(B) At 96 hpf, valve leaflets have formed, and blood flow is uni-directional (black arrow).

(C–E) Single confocal z section plane images of the superior AVC endocardium. (C and D) Single cells express Dll4 and TCF reporter at 48 and 55 hpf (asterisks). (E and E′) Similarly, only single cells express the TCF reporter at 54 hpf (white arrowhead). Those cells are always negative for Notch activity reporter expression.

(F) Light-sheet microscopy time-lapse images of a TCF-positive ingressing endocardial cell (white arrows) at the superior AVC. (F′) Black and white rendering highlights the ingressing cell.

(G–J) Single confocal z section plane images of the superior AVC endocardium at 55 hpf. (G and H) Upon Notch inhibition, the superior AVC endocardium remains monolayered and has a decreased expression of the Dll4 reporter. (I and J) Dll4 expression and singling out of AVC endocardial cells is prevented in absence of blood flow (tnnt2a MO).

(K–N) Quantification of klf2a:YFP levels in luminal versus TCF-positive cells at 48 hpf (K–L) and 55 hpf (M–N). The corrected total cell fluorescence (CTCF) of TCF-positive ingressing cells (white arrowheads) is compared with the CTCF of neighboring TCF-negative cells (yellow arrowheads) (48 hpf, n = 16 embryos; 55 hpf, n = 12 embryos). Single values are shown in a boxplot. Lines inside the box represent mean values. The lower and upper whiskers indicate minimum and maximum values, respectively (∗∗p < 0.01 by paired Student’s t test).

(O) Model depicting the superior AVC endocardium at stages when singled-out cells ingress into the cardiac jelly. Scale bars, 5 μm.

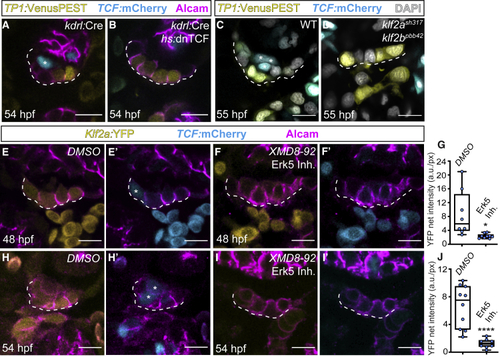
Erk5-Klf2a-Wnt signaling within AVC endocardium is essential for valvulogenesis

(A–D) Single confocal z section plane images of the superior AVC endocardium at 54 hpf. (A and B) The endothelial-specific knockdown of canonical Wnt signaling prevents AVC endocardial cells from ingressing into the cardiac jelly. (A) Presence of a TCF-positive ingressed cell when TCF is not blocked (asterisk). Note the presence of TCF-positive cells in the myocardium of treated hearts (B), which confirms the tissue-specificity of this treatment. (C and D) TCF-positive endocardial cells (asterisks in C) are absent in in klf2ash317;klf2bpbb42 double mutants.

(E–J) Single confocal z section plane images of the superior AVC endocardium at 54 hpf. (E–G and H–J) Quantification of Klf2a:YFP net fluorescent intensity in the superior AVC endocardium of DMSO- and XMD8-92-treated embryos at 48 hpf (E, F, and G) (DMSO-treated, n = 8 embryos; XMD8-92-treated, n = 9 embryos) and 54 hpf (H–J) (DMSO-treated, n = 10 embryos; XMD8-92-treated, n = 8 embryos). Single values are shown in a boxplot. Lines inside the box represent mean values. The lower and the upper whiskers indicate minimum and maximum values, respectively (p < 0.05 and ∗∗∗∗p < 0.0001 by unpaired Student’s t test). (E′, F′, H′, and I′) The presence of single TCF-positive cells (asterisks in E′ and H′) is prevented by treating embryos with XMD8-92 (F′ and I′). Scale bars, 5 μm

wnt9a is essential for atrioventricular endocardial cell ingression into the cardiac jelly

(A and B) Whole-mount in situ hybridization of wnt9a cardiac expression at 48 hpf. (A) wnt9a expression is mainly within the cardiac tissue of the AVC in wild type (black arrowheads). (B) Upon endothelial-specific overexpression of klf2a (fli1a > klf2a), wnt9a is strongly expressed throughout the entire endocardium.

(C–F) Single confocal z section plane images of the superior AVC endocardium at 72 hpf. (C and D) Normal atrioventricular valvulogenesis with TCF-positive cells on the abluminal side of the forming valve (asterisks) in wild-type (C) and wnt9asd49 mutant (D). (E) Endocardial TCF reporter expression is lost upon MO-mediated knockdown of wnt9a. (F) This effect is suppressed in the wnt9asd49 mutant background, as confirmed by the presence of TCF-positive cells on the abluminal side of the forming valve (asterisks).

(G and H) Single confocal z section plane images of the AVC endocardium at 96 hpf. (G) In wild type, the primordium of the AV valve leaflet has formed by 96 hpf. (H) Valvulogenesis is completely aborted and the AV endocardium remains monolayered at 96 hpf upon the MO-mediated knockdown of wnt9a.

(I and J) Model depicting the AVC region of the zebrafish endocardium at 96 hpf. (I) Primordium of the wild-type valve leaflet (as in G). (J) AVC endocardium at 96 hpf upon loss of Wnt9a (as in H). Scale bars, 5 μm

Notch-Dll4 signaling singles out cells that are competent to respond to Wnt9a

(A–D) Single confocal z section plane images of the superior atrioventricular endocardium at 54 hpf (A and B) and 55 hpf (C and D). (B) Treating embryos with the Notch inhibitor RO4929097 prevents TCF expression and ingression of single endocardial cells (asterisk in A). (C and D) Unlike in wild type (C), overexpression of the Notch intracellular domain within endocardium (nfatc > NICD) prevents TCF expression and ingression of endocardial cells (D) (see asterisks in C).

(E–G) Quantification of klf2a:YFP net fluorescence intensity in the superior AVC endocardium of DMSO- versus RO4929097-treated embryos at 54 hpf (DMSO-treated, n = 10 embryos; RO4929097-treated, n = 10 embryos). Single values are shown in a boxplot. Lines inside the box represent mean values. Lower and upper whiskers indicate minimum and maximum values, respectively (ns = not significant by unpaired Student’s t test).

(H) Whole-mount in situ hybridization of fzd9b cardiac expression at 54 hpf. fzd9b expression in the superior AVC endocardium is highlighted by a black arrow.

(I) Quantitative real-time PCR quantifications of kdrl and fzd9b mRNAs in npas4l morphants when normalized to wild-type hearts. Minimum to maximum values are shown (n = 3 experiments; p < 0.05 and ∗∗∗p < 0.001 by ratio paired Student’s t test).

(J and K) Single confocal z section plane images of the superior AVC endocardium at 55 hpf. (J) The ingression of endocardial cells is marked with asterisks. (K) Endocardial TCF reporter expression is lost upon MO-mediated knockdown of fzd9b, and ingression of endocardial cells is prevented.

(L–O) Single confocal z section plane images of the superior AVC endocardium at 72 hpf. Shown are representative cell clones in Tg(fli1a:GAL4FF)ubs3 embryos injected with either UAS:H2B-GFP (L) and treated with RO4929097 (M) or injected with UAS:dll4-H2B-GFP DNA constructs (N) and treated with RO4929097 at 72 hpf (O). Cell clones overexpressing DNA constructs are marked with red asterisks.

(P) Quantifications of ratio of clones that ingressed into the abluminal side with respect to the total number of clones integrated in the superior AVC endocardium (UAS:H2B-GFP-injected, n = 27 embryos; UAS:dll4-H2B-GFP-injected, n = 22 embryos; UAS:dll4-H2B-GFP-injected and RO4929097-treated, n = 16 embryos). Single values are shown in a boxplot. Lines inside the box represent mean values. Lower and upper whiskers indicate minimum and maximum values, respectively. (∗∗p < 0.01 by unpaired Student’s t test).

(Q) Model of blood-flow-dependent molecular mechanisms that result in singling out of atrioventricular endocardial cells at the beginning of valve morphogenesis. Scale bars, 5 μm

Acknowledgments
This image is the copyrighted work of the attributed author or publisher, and ZFIN has permission only to display this image to its users. Additional permissions should be obtained from the applicable author or publisher of the image. Full text @ Cell Rep.