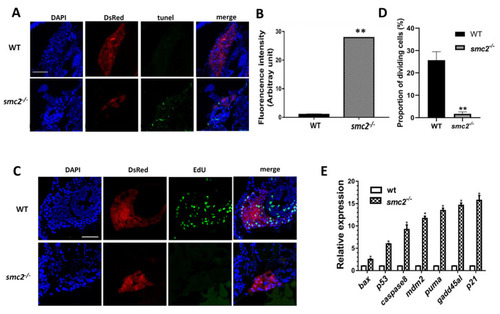
Hepatocellular apoptosis increased in SMC2−/− mutants. (A) TUNEL analysis of apoptotic cells in the liver of WT and homozygous mutants under the Tg (fabp10a:dsRed; ela3l: EGFP) transgenic background at 96 hpf. Scale bar, 50 μm. (B) Quantitative analysis of the apoptotic cells in the liver. Fluorescence intensities of three WT and three mutant embryos across the liver were determined using the ImageJ software. **, p < 0.01. (C) Frozen sections were stained with EdU staining buffer and nuclei counterstained with DAPI (blue) under the Tg (fabp10a:dsRed; ela3l: EGFP) transgenic background at 96 hpf. Scale bar, 50 μm. (D) The proportions of EdU-positive cells vs. DAPI-positive cells in the liver of three WT and three SMC2 mutant embryos were determined using the ImageJ software. **, p < 0.01. (E) The mRNA levels of genes involved in apoptotic pathways were analyzed with qPCR. Expression levels were normalized to WT. The data expressed as mean ± SD were representatives of three independent experiments containing 40 embryos per sample. *, p < 0.01.
|
