|
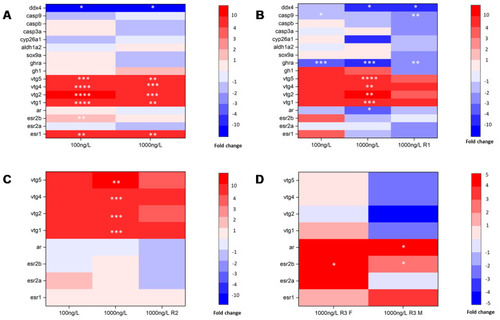
Genes for growth, HPG axis, sex hormone receptor, and gonadal differentiation and development) expression in every exposure stage. (A) IDS exposure group at 25 dpf; (B) GDS exposure group and the highest concentration (1000 ng/L) IDS exposure group at 45 dpf; (C) GMS exposure group and highest concentration GDS exposure group at 60 dpf; (D) highest concentration GMS exposure group at 90 dpf. Mean values of normalized transcript levels in each treatment were used to draw heat map (n = 3 replicates per treatment, n = 3 fish per replicate at 25 dpf, and n =1 fish per replicate at 45, 60, and 90 dpf). Asterisks denote significant differences between the control and treatments (* p < 0.05, ** p < 0.01, *** p < 0.005 and **** p < 0.0001, according to Dunnett’s multiple comparisons test). R1: IDS exposure group at 45 dpf. R2: GDS exposure group at 60 dpf. R3: GMS exposure group at 90 dpf. F: female. M: male.
|