
Figure 10
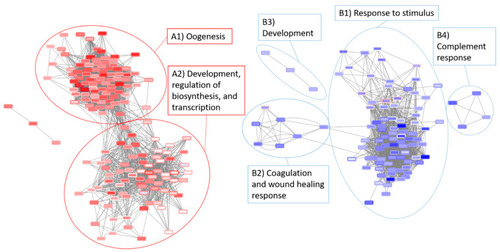
Integrated networks of the radiation (28.5-rad) and the torpor+radation group (18.5-mel-rad) generated by NetNC analysis. Fold change values for the radiation group are shown by node fill colour, values for torpor + radiation are represented by the shape border colour. Node shapes indicate: NetNC-predicted coherent genes in both groups (rectangular), in the radiation group only (oval), in the torpor + radiation group only (diamond) and changed in opposite directions (triangular). Results from each condition show very substantial overlap, with some notable differences being the upregulation of genes in the torpor + radiation group (18.5-mel-rad vs. 28.5-Ctrl) that confer radio-resistance (TXN, GSTP1) and promote survival (HMGB1). |