
FIGURE
Figure 4
Figure 4
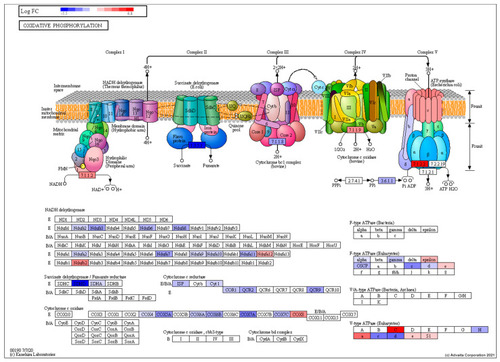
Pathway topological diagram of the oxidative phosphorylation pathway produced by KEGG showing differentially expressed genes from a comparison between the torpor and control group showing the torpor group experienced an overall downregulation of several key subunits of electron transport chain proteins such as NADH dehydrogenase, succinate dehydrogenase and cytochrome c oxidase, indicating reduced energy production. RED: upregulated, BLUE: downregulated. |
Expression Data
Expression Detail
Antibody Labeling
Phenotype Data
Phenotype Detail
Acknowledgments
This image is the copyrighted work of the attributed author or publisher, and
ZFIN has permission only to display this image to its users.
Additional permissions should be obtained from the applicable author or publisher of the image.
Full text @ Cells