
FIGURE
Figure 5
Figure 5
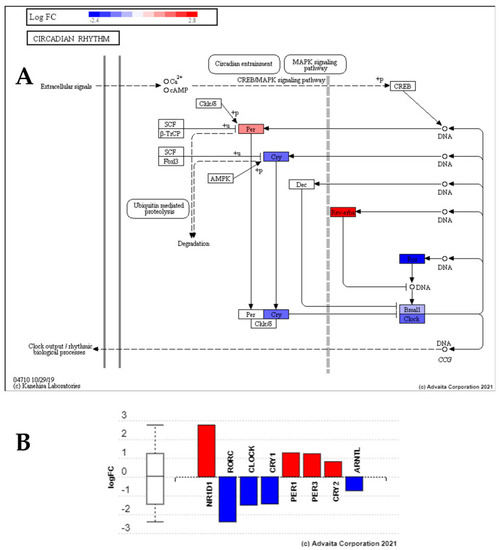
Perturbation of circadian rhythm pathway genes from exposure to low dose radiation compared to control group. This reveals upregulation of Per and Rev-Erba, and the downregulation of Cry, Clock, Bmal and Arntl in comparison to the control group (28.5-Ctrl), suggesting low dose radiation perturbs the circadian rhythm. (A) Pathway topological diagram showing position and regulation of differentially expressed circadian rhythm genes. RED: upregulated, BLUE: downregulated. (B) Bar chart showing fold change of differential expression of the key clock genes. |
Expression Data
Expression Detail
Antibody Labeling
Phenotype Data
Phenotype Detail
Acknowledgments
This image is the copyrighted work of the attributed author or publisher, and
ZFIN has permission only to display this image to its users.
Additional permissions should be obtained from the applicable author or publisher of the image.
Full text @ Cells