
FIGURE
Figure 8
Figure 8
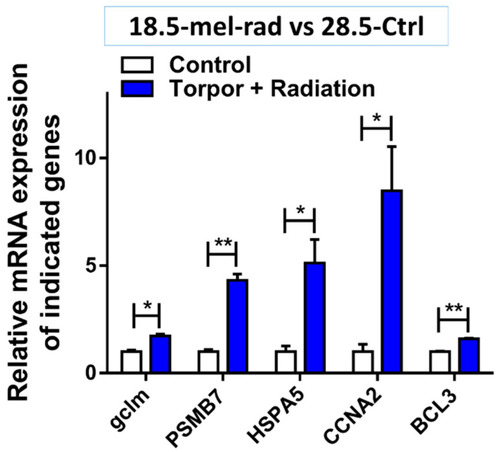
Validation of gene expression in the torpor + radiation (18.5-mel-rad) group compared with control (28.5-Ctrl). The figure shows the increase in expression of GCLM (p = 0.011), PSMB7 (p = 0.004), HSPA5 (p = 0.035), CCNA2 (p = 0.036) and BCL3 (p = 0.001911), relative to the control (28.5-Ctrl) involved in glutathione metabolism, proteasome complex, protein refolding, cell cycle and anti-apoptosis, respectively. * p < 0.05, ** p < 0.001. |
Expression Data
Expression Detail
Antibody Labeling
Phenotype Data
Phenotype Detail
Acknowledgments
This image is the copyrighted work of the attributed author or publisher, and
ZFIN has permission only to display this image to its users.
Additional permissions should be obtained from the applicable author or publisher of the image.
Full text @ Cells