
Fig. 4
- ID
- ZDB-FIG-210426-15
- Publication
- Duszyc et al., 2021 - Mechanotransduction activates RhoA in the neighbors of apoptotic epithelial cells to engage apical extrusion
- Other Figures
- All Figure Page
- Back to All Figure Page
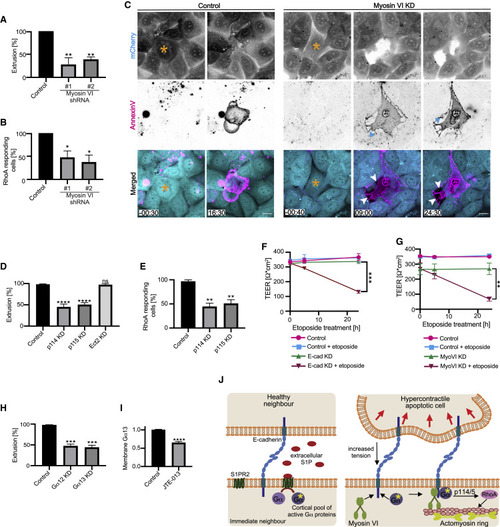
Myosin-VI-dependent mechanotransduction engages the neighbors of apoptotic cells to mediate extrusion and preserve epithelial integrity (A and B) Effect of myosin VI RNAi (KD) on (A) apoptotic cell extrusion and (B) activation of RhoA in immediate neighbor cells (percentage of cells that showed a preferential increase in GFP-AHPH at the apoptotic:neighbor interface) induced by laser irradiation. See also Figure S4F. (C) Morphological impact of myosin VI RNAi on apoptotic extrusion. Montage from video of cells marked by expression of mCherry (whose loss marks the irradiated cells) is shown. Extrusion is blocked and neighbors retract from apoptotic cells with myosin VI KD (cyan arrowheads: retraction fibers; white arrowheads: gaps between the apoptotic cell and its immediate neighbors). (D and E) Contribution of RhoA GEFs to apoptotic extrusion (D) and activation of RhoA in the immediate neighbors (E). (F) Effect of E-cadherin RNAi on transepithelial electrical resistance (TEER) in controls and after stimulation of apoptosis with etoposide (250 μM). (G) Effect of myosin VI RNAi on TEER in controls and after stimulation of apoptosis with etoposide (250 μM). (H) Effect of Gα12 or Gα13 RNAi on apoptotic extrusion induced with etoposide (measured after 5 h; 250 μM). (I) Effect of JTE-013 (20 μM) on membrane localization of GFP-Gα13 in control condition and upon JTE-013 treatment (20 μM). Data represent membrane:cytosolic intensity of transgene fluorescence normalized to the mean value in the controls. See also Figures S4G and S4H. (J) Model: mechanotransduction and S1P signaling cooperate to activate RhoA in neighbor cells. Scale bars represent 15 μm. All data are means ± SEM; ns, not significant; ∗p < 0.05; ∗∗p < 0.01; ∗∗∗p < 0.001; ∗∗∗∗p < 0.0001; calculated from n = 3 independent experiments analyzed with one-way ANOVA Dunnett’s multiple comparisons test (A, B, D, E, and H), Student’s t test (I), or two-way ANOVA Sidak’s multiple comparisons test (F and G). Time is mm:ss. XY panels present maximum projection of all acquired z stacks. |