
- Title
-
Mechanotransduction activates RhoA in the neighbors of apoptotic epithelial cells to engage apical extrusion
- Authors
- Duszyc, K., Gomez, G.A., Lagendijk, A.K., Yau, M.K., Nanavati, B.N., Gliddon, B.L., Hall, T.E., Verma, S., Hogan, B.M., Pitson, S.M., Fairlie, D.P., Parton, R.G., Yap, A.S.
- Source
- Full text @ Curr. Biol.
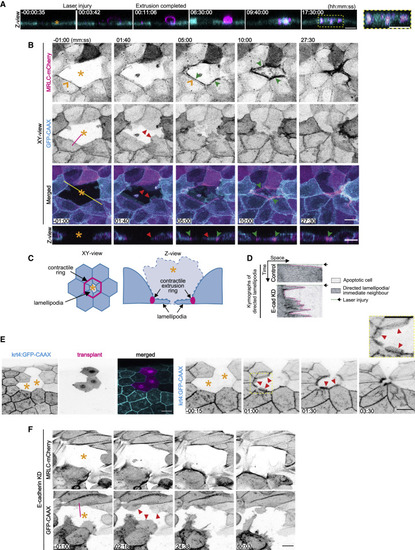
Apical extrusion eliminates apoptotic cells from epithelia (A) Montage of XZ images from a video when apoptosis was induced in a target cell (asterisk) by laser microirradiation of its nucleus. Cells expressed MRLC-GFP (cyan) and apoptosis was identified with annexin V labeling (magenta). A high-magnification view shows annexin-V-positive cell fragments that were internalized after the apoptotic cell was extruded. See also Figure S1A and Video S1. (B) Visualization of contractile networks (MRLC-mCherry) and lamellipodia (GFP-CAAX) in neighbors as an apoptotic cell (asterisk) is extruded. Montage of XY and Z views from Video S2. MRLC-mCherry pre-exists at the ZA (orange arrowheads) and then also accumulates in a separate extrusion contractile ring (green arrowheads) that constricts as neighbor cells extend lamellipodia (red arrowheads) under the apoptotic cell. Fluorescence contrast is inverted. Yellow line represents position of the Z views. (C) Schematic diagram of lamellipodial and contractile responses in neighbor cells during apoptotic extrusion. (D) Representative kymographs of lamellipodia (marked by GFP-CAAX) in immediate neighbors of apoptotic cells from control and E-cadherin RNAi monolayers. Kymographs were obtained at the magenta lines in the GFP-CAAX channel from (B) (control) and (F) (E-cadherin KD). Arrowheads mark the time when laser injury was induced. See also Figure S1F. (E) Lamellipodia (GFP-CAAX) in neighbors of apoptotic cells (asterisks) in zebrafish periderm. Non-expressing cells were transplanted from a wild-type fish into the tg(krt4:GFP-CAAX) host embryos and injured by laser microirradiation at 2 dpf. See also Video S3. (F) MRLC-mCherry and lamellipodia (GFP-CAAX, red arrowheads) in neighbors of apoptotic cell (asterisk) in an E-cadherin KD monolayer. See also Video S4. Scale bars represent 15 μm. Time is hh:mm:ss (A) or mm:ss (B, E, and F). XY panels are maximum projection views from z stacks. |
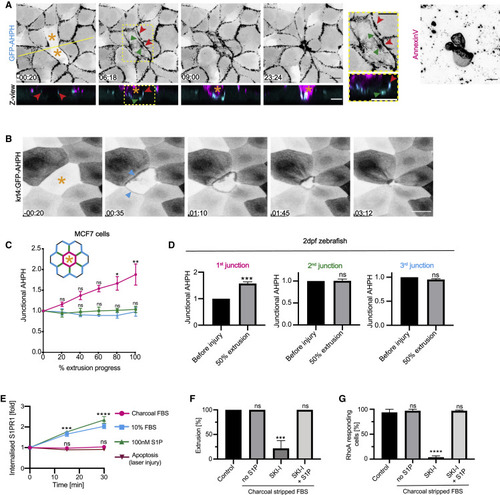
RhoA is stringently activated at the interface between apoptotic cells and their immediate neighbors (A) AHPH in neighbors of apoptotic MCF7 cells: montage of XY and Z views (from Video S2). AHPH was present at the ZA (red arrowheads) prior to induction of apoptosis (−00:20). After apoptosis was induced, a separate pool appeared at the apoptotic:neighbor interface below the ZA pool (green arrowheads). Yellow line represents position of the Z views. See also Figure S2A. (B) AHPH in neighbor cells within the 2-dpf zebrafish periderm. A cell that did not express AHPH was laser microirradiated (asterisk); AHPH at the neighbor:apoptotic interface is marked (arrowheads). Images are sum of slices projection from z stacks. See also Video S3. (C and D) Spatial distribution of RhoA activity. Junctional GFP-AHPH was quantitated in nearest neighbor cells for MCF7 monolayers (C) and zebrafish periderm (D). We measured AHPH at the junctions that immediate neighbors made with the apoptotic cell (magenta, 1st junction), other neighbor cells in the first row around the apoptotic cell (2nd junction, green), and with epithelial cells in the second row (3rd junction, cyan). The time evolution of AHPH levels was measured for MCF7 cells (C) although AHPH was measured at 50% extrusion in the periderm (D). (E) Exogenously delivered S1P, but not apoptosis, triggers internalization of S1P1-GFP. S1P1 is rapidly internalized upon S1P (100 nM) treatment or addition of regular S1P-containing serum (10%); however, apoptosis does not trigger internalization of the receptor. See also Figure S2G. (F and G) Effect of S1P depletion on apoptotic cell extrusion induced by laser irradiation (F) and neighbor cell RhoA activation (G). Extrusion was quantified in cells supplemented with 10% regular FBS (control) or 10% charcoal-stripped FBS (no S1P) treated with SKI-I (10 μM) or S1P (100 nM) and SKI-I (10 μM). See also Figure S2H. Scale bars represent 15 μm. All data are means ± SEM; ns, not significant; ∗p < 0.05; ∗∗p < 0.01; ∗∗∗p < 0.001; ∗∗∗∗p < 0.0001; calculated from n = 3 independent experiments analyzed with one-way ANOVA Dunnett’s multiple comparisons test (C and E–G) or Student’s t test (D). Time is mm:ss. XY panels present maximum projection of all acquired z stacks unless indicated otherwise. |
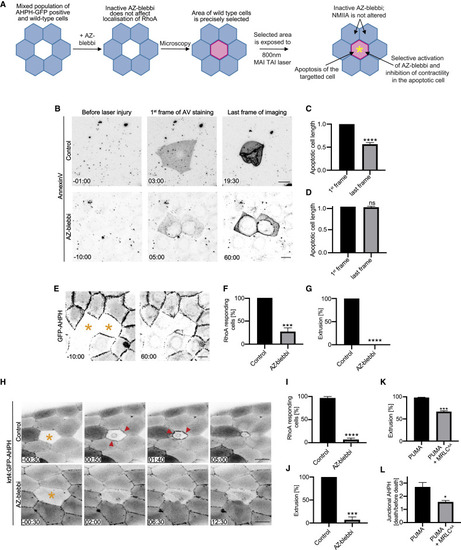
Contractility in the apoptotic cell is necessary for it to activate RhoA in its neighbors (A) Schematic diagram of the experimental design for simultaneous activation of azido-blebbistatin (AZ-blebbi) and induction of apoptosis in targeted cells. (B–D) Azido-blebbistatin allows contractility to be inhibited in apoptotic cells. (B) Morphological changes when apoptosis was sporadically induced by laser microirradiation in confluent control and azido-blebbistatin-treated monolayers. To quantitate contractility, we measured the longest axis of the apoptotic cells for controls (C) and azido-blebbistatin (20 μM)-treated cultures (D) from when annexin-V labeling was first evident (1st frame) till either extrusion was completed (for controls, last frame) or 60 min after injury (AZ-blebbi, last frame). (E–G) Activation of azido-blebbistatin in apoptotic cells prevents activation of RhoA in neighbors and inhibits extrusion. (E) Representative montage of GFP-AHPH in neighbors of apoptotic cells where azido-blebbistatin had been simultaneously activated (asterisks). (F and G) Activation of (F) RhoA in neighbors, measured as the percentage of cells that showed a preferential increase in GFP-AHPH at the apoptotic:neighbor interface and (G) apoptotic extrusion. See also Figure S3F. (H–J) Activation of azido-blebbistatin in apoptotic cells in zebrafish periderm prevents activation of RhoA in neighbors and inhibits extrusion. (H) Representative montage of GFP-AHPH in neighbors of apoptotic cells (asterisk) in control (top panels) and where azido-blebbistatin had been simultaneously activated (asterisk, bottom panels). (I and J) Activation of (I) RhoA in neighbors, measured as the percentage of cells that showed a preferential increase in GFP-AHPH at the apoptotic:neighbor interface and (J) apoptotic extrusion. (K and L) Inhibition of apoptotic contractility prevents extrusion (K) and activation of RhoA in neighbors (L) when apoptosis was induced in Caco2 cells by PUMA. Apoptotic cell contractility was inhibited by co-expression of inhibitory MRLCAA in the PUMA cells. Junctional AHPH was quantified as the fold change of fluorescence intensity at the frame when apoptosis was confirmed by Draq7 staining relative to the intensity of AHPH before apoptosis. See also Figures S3I and S3J. Scale bars represent 15 μm. All data are means ± SEM; ns, not significant; ∗p < 0.05; ∗∗∗p < 0.001; ∗∗∗∗p < 0.0001; calculated from n = 3 independent experiments analyzed with Student’s t test. Time is mm:ss. XY panels present maximum projection of all acquired z stacks. |
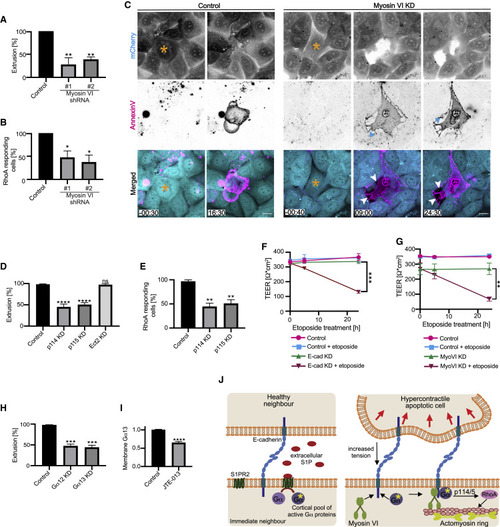
Myosin-VI-dependent mechanotransduction engages the neighbors of apoptotic cells to mediate extrusion and preserve epithelial integrity (A and B) Effect of myosin VI RNAi (KD) on (A) apoptotic cell extrusion and (B) activation of RhoA in immediate neighbor cells (percentage of cells that showed a preferential increase in GFP-AHPH at the apoptotic:neighbor interface) induced by laser irradiation. See also Figure S4F. (C) Morphological impact of myosin VI RNAi on apoptotic extrusion. Montage from video of cells marked by expression of mCherry (whose loss marks the irradiated cells) is shown. Extrusion is blocked and neighbors retract from apoptotic cells with myosin VI KD (cyan arrowheads: retraction fibers; white arrowheads: gaps between the apoptotic cell and its immediate neighbors). (D and E) Contribution of RhoA GEFs to apoptotic extrusion (D) and activation of RhoA in the immediate neighbors (E). (F) Effect of E-cadherin RNAi on transepithelial electrical resistance (TEER) in controls and after stimulation of apoptosis with etoposide (250 μM). (G) Effect of myosin VI RNAi on TEER in controls and after stimulation of apoptosis with etoposide (250 μM). (H) Effect of Gα12 or Gα13 RNAi on apoptotic extrusion induced with etoposide (measured after 5 h; 250 μM). (I) Effect of JTE-013 (20 μM) on membrane localization of GFP-Gα13 in control condition and upon JTE-013 treatment (20 μM). Data represent membrane:cytosolic intensity of transgene fluorescence normalized to the mean value in the controls. See also Figures S4G and S4H. (J) Model: mechanotransduction and S1P signaling cooperate to activate RhoA in neighbor cells. Scale bars represent 15 μm. All data are means ± SEM; ns, not significant; ∗p < 0.05; ∗∗p < 0.01; ∗∗∗p < 0.001; ∗∗∗∗p < 0.0001; calculated from n = 3 independent experiments analyzed with one-way ANOVA Dunnett’s multiple comparisons test (A, B, D, E, and H), Student’s t test (I), or two-way ANOVA Sidak’s multiple comparisons test (F and G). Time is mm:ss. XY panels present maximum projection of all acquired z stacks. |