
Fig. 1
- ID
- ZDB-FIG-210426-12
- Publication
- Duszyc et al., 2021 - Mechanotransduction activates RhoA in the neighbors of apoptotic epithelial cells to engage apical extrusion
- Other Figures
- All Figure Page
- Back to All Figure Page
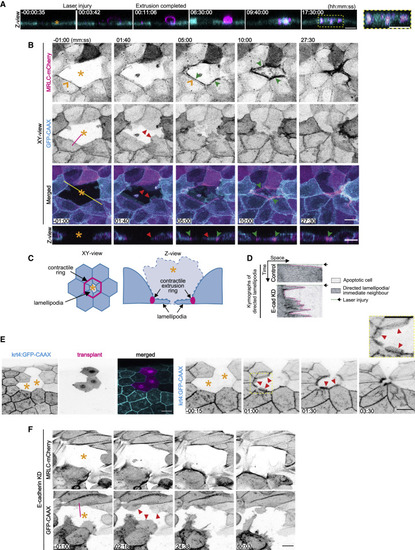
Apical extrusion eliminates apoptotic cells from epithelia (A) Montage of XZ images from a video when apoptosis was induced in a target cell (asterisk) by laser microirradiation of its nucleus. Cells expressed MRLC-GFP (cyan) and apoptosis was identified with annexin V labeling (magenta). A high-magnification view shows annexin-V-positive cell fragments that were internalized after the apoptotic cell was extruded. See also Figure S1A and Video S1. (B) Visualization of contractile networks (MRLC-mCherry) and lamellipodia (GFP-CAAX) in neighbors as an apoptotic cell (asterisk) is extruded. Montage of XY and Z views from Video S2. MRLC-mCherry pre-exists at the ZA (orange arrowheads) and then also accumulates in a separate extrusion contractile ring (green arrowheads) that constricts as neighbor cells extend lamellipodia (red arrowheads) under the apoptotic cell. Fluorescence contrast is inverted. Yellow line represents position of the Z views. (C) Schematic diagram of lamellipodial and contractile responses in neighbor cells during apoptotic extrusion. (D) Representative kymographs of lamellipodia (marked by GFP-CAAX) in immediate neighbors of apoptotic cells from control and E-cadherin RNAi monolayers. Kymographs were obtained at the magenta lines in the GFP-CAAX channel from (B) (control) and (F) (E-cadherin KD). Arrowheads mark the time when laser injury was induced. See also Figure S1F. (E) Lamellipodia (GFP-CAAX) in neighbors of apoptotic cells (asterisks) in zebrafish periderm. Non-expressing cells were transplanted from a wild-type fish into the tg(krt4:GFP-CAAX) host embryos and injured by laser microirradiation at 2 dpf. See also Video S3. (F) MRLC-mCherry and lamellipodia (GFP-CAAX, red arrowheads) in neighbors of apoptotic cell (asterisk) in an E-cadherin KD monolayer. See also Video S4. Scale bars represent 15 μm. Time is hh:mm:ss (A) or mm:ss (B, E, and F). XY panels are maximum projection views from z stacks. |