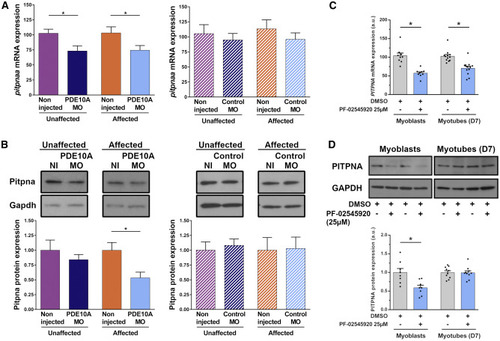
PDE10A Inhibition Leads to Reduction of PITPNA Expression in Dystrophin-Deficient Zebrafish and DMD Patient-Derived Myoblasts Pairs of sapje-like+/− zebrafish were mated and pde10a morpholino or standard control morpholino (negative control) was injected in one-cell-stage progeny embryos. At 4 dpf, a birefringence assay was performed and unaffected (normal muscle birefringence phenotype) as well as affected larvae (abnormal muscle birefringence phenotype) were collected. In each experiment, morphant zebrafish were compared to non-injected siblings. (A) Total mRNA was extracted from 10 (n = 10) zebrafish per biological replicate and TaqMan qRT-PCR was performed. Bar graphs show pitpna mRNA expression normalized to hprt1. In each experiment, the replicate was run three times and at least five (N = 5) independent experiments were performed. Statistical differences between groups are presented as follows: ∗p < 0.05 (t test, ±SEM). (B) Total proteins were extracted from 20 (n = 20) zebrafish per biological replicate and western blotting was performed. Upper panel: representative western blot images from Pitpna and Gapdh antibodies. Lower panel: bar graph showing Pitpna protein expression normalized to Gapdh. At least four (N = 4) independent experiments were performed. Statistical differences between groups are presented as follows: ∗p < 0.05 (t test, ±SEM). (C) In a primary culture of CD56-positive myoblasts and myotubes (at day 6 of differentiation) from DMD patients, 25 μM PDE10A inhibitor PF-02545920 or 0.25% DMSO (control) was applied for 24 h. Total mRNA was extracted and TaqMan qRT-PCR was performed. Bar graph shows PITPNA mRNA expression normalized to GAPDH. (D) Total proteins were extracted and western blotting was performed. Upper panel: representative western blot images with PITPNA and GAPDH antibodies. Lower panel: bar graph showing PITPNA protein expression normalized to GAPDH. In each experiment, two DMD patient cell lines were used, and replicates were run three times in at least three (N = 3) independent experiments. Statistical differences between groups are presented as follows: ∗p < 0.05 (t test, ±SEM).
|
