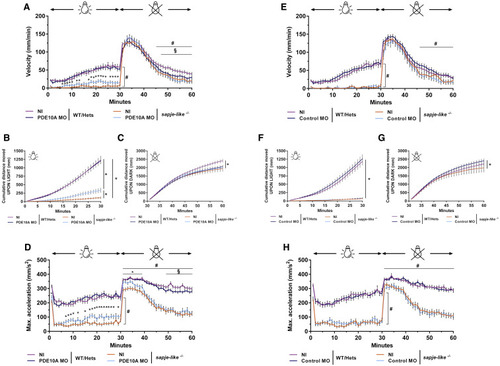
Improvement in Locomotion of pde10a Morphant Dystrophin-Deficient Zebrafish Pairs of sapje-like+/− zebrafish were mated and pde10a morpholino or standard control morpholino (negative control) was injected in one-cell-stage progeny embryos. At 4 dpf, a birefringence assay was performed and unaffected larva (normal muscle birefringence phenotype) as well as affected larvae (abnormal muscle birefringence phenotype) were set in 48-well plates. At 5 dpf, following a dark period of acclimation, a light/dark locomotion assay was performed in the DanioVision observation chamber (Noldus) and data were generated from EthoVision XT tracking software (Noldus). In each experiment, morphant zebrafish were compared to non-injected siblings. At the end of the experiment, fish were collected and genotyped. (A–D) pde10a morpholino experiments. (E–H) Standard control morpholino experiments. (A and E) Graphs show swimming velocity (mm/min) for the entire assay. # indicates statistical differences between NI SL−/− and NI WT/Hets larvae; asterisk (∗) indicates statistical differences between NI SL−/− and pde10a morphant SL−/− larvae; § indicates statistical differences between NI WT/Hets and pde10a morphant WT/Hets (p < 0.05, t test, ±SEM). (B and F) Graphs show cumulative distance traveled (mm) for 30-min light period. Statistical differences between groups are presented as follows: ∗p < 0.05 (t test, ±SEM). (C and G) Graphs show cumulative distance traveled (mm) for 30-min dark period following light-to-dark transition. Statistical differences between groups are presented as follows: ∗p < 0.05 (t test, ±SEM). (D and H) Graphs show maximum acceleration capacity (mm/s2) for the entire assay. # indicates statistical differences between NI SL−/− and NI WT/Hets larvae; asterisk (∗) indicates statistical differences between NI SL−/− and pde10a morphant SL−/− larvae; § indicates statistical differences between NI WT/Hets and pde10a morphant WT/Hets (p < 0.05, t test, ±SEM). From 90 to 230 (n = 90–230) zebrafish were analyzed per condition within at least four (N = 4) independent experiments.
|
