
Fig. 5
- ID
- ZDB-FIG-210329-40
- Publication
- Iwasaki et al., 2020 - Development of the anterior lateral line system through local tissue-tissue interactions in the zebrafish head
- Other Figures
- All Figure Page
- Back to All Figure Page
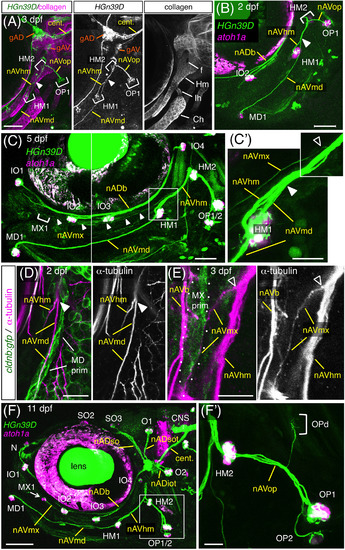
Axonal projections to the anteroventral (AV) neuromasts. A, Axonal projections in 3 dpf‐HGn39D embryo labeled with anti‐type II collagen antibody. Arrowhead indicates the position where nAVmd leaves the nAVhm. Hm, hyomandibular, Ih, interhyal; Ch, ceratohyal cartilages; f, foramen of Hm. B, C HGn39D;atoh1a:rfp embryos at 2 dpf (B) and 5 dpf (C). C′, Higher magnification of the box area in C. Positions where nAVmx and nAVmd leave nAVhm are indicated by open and filled arrowheads, respectively. D, E, cldnb:gfp embryos labeled with the anti‐acetylated α‐tubulin antibody at 2 dpf (D) and 3 dpf (E). The MD and MX primordia are accompanied by nAVmd (D) and nAVmx (E), respectively. F, Axonal projections to the ALL neuromasts in 11 dpf‐HGn39D;atoh1a:rfp. MX1 forms at the anterior end of the nAVmx (arrow). F′, Opercular branches, corresponding to the boxed area in F. Lateral views, anterior is to the left. Scale bars: 50 μm (A‐C, F); 20 μm (C′, D, F′); 10 μm (E) |