
Fig. 2
- ID
- ZDB-FIG-210329-37
- Publication
- Iwasaki et al., 2020 - Development of the anterior lateral line system through local tissue-tissue interactions in the zebrafish head
- Other Figures
- All Figure Page
- Back to All Figure Page
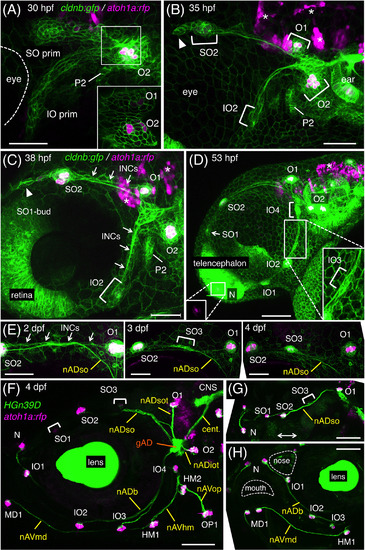
Development of the anterodorsal (AD) system. A, B, Pre‐otic region of cldnb:gfp;atoh1a:rfp embryo at 30 hpf (A) and 35 hpf (B). Two lateral line primordia, SO prim and IO prim, and developing neuromasts are indicated. Arrowhead indicates a cellular extension of the migrating SO prim. P2, the second pharyngeal pouch. Inset, single confocal plane corresponding to the boxed area in A. C, D, Formation of bud and intercalary neuromasts at 38 hpf (C) and 53 hpf (D). SO2 buds off SO1, while IO2 buds off IO1 and N. IO3 and IO4 form through the proliferation of INCs (indicated by arrows in C). Inset in the left bottom indicates atoh1a:rfp‐expression in N. Inset in the right bottom is a higher magnification of IO3. E, Time‐course observation of SO3 formation through the proliferation of INCs. F‐H, Axonal projections to the ALL neuromasts in HGn39D;atoh1a:rfp embryo at 4 dpf. Lateral views, anterior is to the left except for G (dorsal view, the double‐headed arrow indicates the midline of the fish) and H (semi‐frontal view). Scale bars: 50 μm (A‐C, E‐H); 100 μm (D) |